A bar chart is a chart with rectangular bars with lengths proportional to the values that they represent. The bars can be plotted vertically or horizontally. Bar charts can be used to show comparisons among categories.
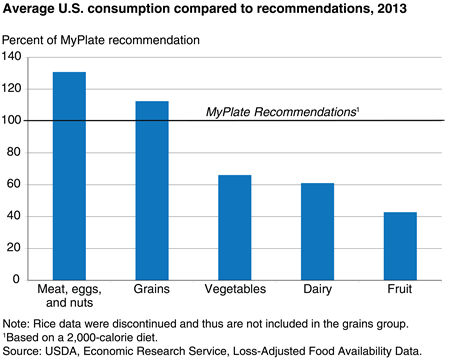
The bar chart below shows how the average U.S. diet compares with recommended dietary percentages.
source:ers.usda.gov
Are there any food groups the average person in the U.S. eats too little of (compared to the recommended amount)?
Show answerSolution: Find any bars that do not reach the “MyPlate Recommendations” line (which is at 100% on the y-axis). Vegetables, dairy, and fruit do not reach this bar, and this means that the average person in the U.S. does not meet recommended amounts for these food groups.
To make a bar chart, decide what columns and rows to include. The chart above relates five food groups (food group is the x-axis variable) to a percentage (the y-axis variable). However, bar charts can display more than just two variables. Generally, if multiple things are being compared, one axis will be a variable that links all other parameters.
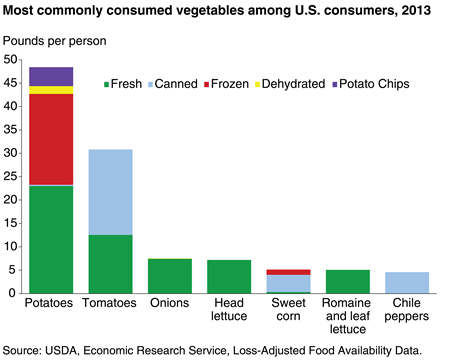
For example, the chart below shows vegetable type on the x-axis, and shows both pounds per person and whether the food was canned, frozen, fresh, etc. on the y-axis. This graph is able to display two variables on one axis because it uses color to distinguish the state of the food.
source:ers.usda.gov
To read a bar chart, determine which parameters are being compared by reading the components of the x and y-axes and taking note of how parameters are related. Some parameters are related by space (a taller bar might mean there is more of that element than a shorter bar) while others could be related by color. In the chart above, for example, all frozen foods are denoted by the color red.
Using the chart above, determine the pounds of fresh romaine and leaf lettuce consumed per person.
Show answerSolution: We can tell from the key above the bars that the color green indicates a fresh vegetable. Looking at the romaine and leaf lettuce column, we can see that a little more than 5 pounds of fresh lettuce was consumed per person.
Grapes Apples Watermelon Oranges BananasWhat is the third most popular kind of fruit among U.S. consumers according to this bar chart?

source: ers.usda.gov

What is wrong with this chart? source: wikipedia
Show answer
Here is the chart with a better scale. source: wikipedia
![]()