
Since 1962, Statistics Canada has collected information on all criminal incidents reported by Canadian police services through its annual Uniform Crime Reporting (UCR) Survey. Note In addition to the UCR , Statistics Canada also collects information on self-reported criminal victimization through the General Social Survey (GSS) on Canadians’ Safety (Victimization), which is conducted every five years. Unlike the UCR , the GSS on Victimization collects self-reported data which includes incidents that may not have been brought to the attention of the police. These complementary surveys provide a more complete picture of crime and victimization in Canada.
This Juristat article presents findings from the 2020 UCR Survey to provide information on police-reported crime across Canada and over time. To publish police-reported crime statistics in a timely manner, this article relies mostly on aggregate data (totals), which are the first crime data available each calendar year. To inform some safety issues which are particularly relevant to the pandemic, such as family violence and hate crime, this article also draws on detailed disaggregated data on the characteristics of incidents, victims and accused persons. These disaggregated data will also be available for custom requests and will be included in future analytical products. Note Crime counts presented in the article are based on the most serious violation in a criminal incident (see “Key terminology and definitions”).
This article first provides an overview of important context surrounding Canadian crime in 2020 given the impact of the COVID-19 pandemic. This is followed by an analysis of the key statistical trends reported by police in 2020, and the offences driving these trends in crime. The article also explores more general trends in the volume and severity of police-reported crime at the national, provincial/territorial and census metropolitan area (CMA) levels, as well as more detailed information on changes in violent and non-violent criminal offences. Finally, the article looks at trends for youth accused of crime. Note
Police-reported crime statistics reflect only those incidents that are reported to the police, which can be affected by large-scale criminal events, social movements and changes in legislation, policies and procedures (see Text box 1).
The COVID-19 pandemic has had profound impacts on Canada’s economy, health care system and society in general. Policies enacted to contain the spread of the virus have resulted in unprecedented disruptions in the social and economic lives of Canadians, changing how we interact, socialize, learn, work and consume. Since March 2020, the vast majority of Canada’s population were typically spending more time at home and many businesses closed or turned to new methods of operation, often online. These changes have, at least partially, affected crime patterns across the country.
Stay-at-home orders meant more people were home for longer periods of time, increasing guardianship, while fewer people were outside with the opportunity to commit crimes. For some people, however, confinement at home posed a risk where family violence was a factor. For crimes that can be difficult to report due to the nature of the offence—for example crimes committed by family members—confinement and reduction or changes in services for victims could have also impacted reporting to police.
During the pandemic, Canadians turned to the Internet to facilitate work, school, shopping, health care and social interaction (Bilodeau et al. 2021; Statistics Canada 2020a). A greater online presence could increase the risk for different types of criminal offences facilitated by the Internet.
Finally, the pandemic could have also impacted offences against the administration of justice, such as breach of probation and failure to appear in court or at mandatory meetings with probation or parole officers. Lockdown conditions meant fewer opportunities to breach conditions and the reduction of court processes and in-person hearings would impact the possibility to fail to appear. Information on the broader social and economic impacts of the COVID-19 pandemic can be found on “Statistics Canada’s COVID-19 hub.”
Start of text box 1
There are many factors that influence police-reported crime statistics. First, an incident must come to the attention of police. The decision by an individual to report a criminal incident to police has a considerable impact on the number of crimes ultimately recorded by police. The 2019 General Social Survey on Canadians’ Safety (Victimization), which provides information on the crime reporting behaviour of Canadians aged 15 and older for selected offences, indicated that about one-third (29%) of crimes are reported to police (see Text box 9 for more information on self-reported and police-reported data).
Second, differences between individual police services—such as available resources or departmental priorities, policies and procedures—can also have an effect on police-reported crime. For instance, as a crime prevention measure, some police services have implemented initiatives to focus attention on prolific or repeat offenders within the community. Moreover, certain crimes such as impaired driving and drug offences can be significantly affected by enforcement practices, with some police services devoting more resources to these specific types of crime. Some police services may also rely on municipal bylaws or provincial statutes to respond to minor offences such as mischief and disturbing the peace.
Third, and more broadly, social and economic factors can influence the volume of police-reported crime at a national, regional, municipal or neighbourhood level. In particular, crime rates can be affected by changes in age demographics (Britt 2019; Loeber et al. 2015), economic conditions (Wilson 2018; Janko and Popli 2015), neighbourhood characteristics (Ha and Andresen 2017), the emergence of new technologies (Milivelojevic and Radulski 2020; Brewer et al. 2018; McGovern 2015) and Canadians’ attitudes toward crime and risky behaviour (Ouimet 2004).
End of text box 1
Overall, the police-reported crime rate (excluding traffic offences) in Canada decreased 10% from 2019 to 2020. The annual rates of violent crime (-2%), property crime (-13%), and other Criminal Code offences (-10%) all decreased for the first time after five years of increases. Additionally, the rates of police-reported drug offences under the CDSA and the Cannabis Act (-5%) and other federal statute violations (-22%) saw large declines in 2020 (Table 1).
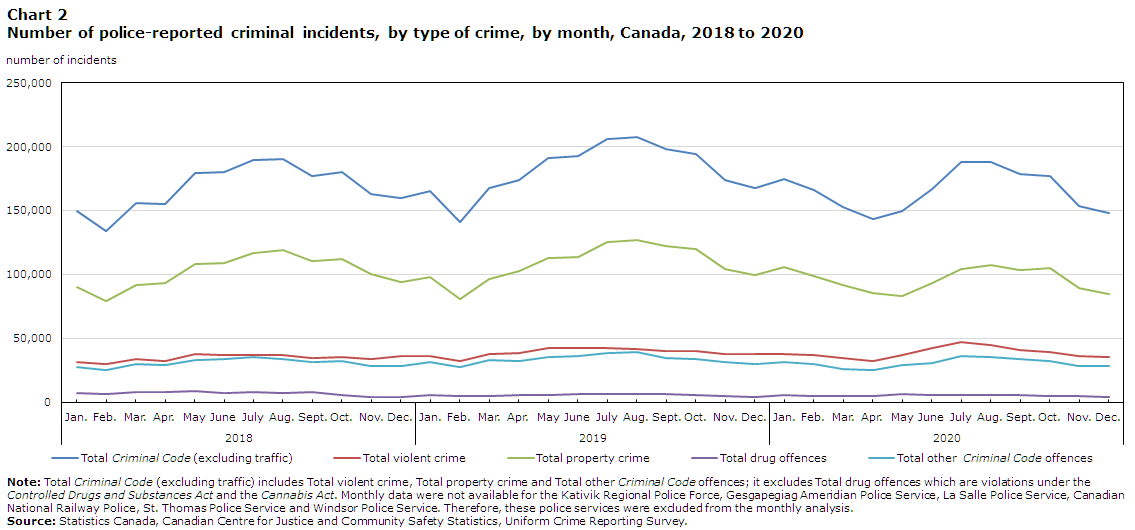
In the first three months of 2020, the number of police-reported criminal incidents increased 4% compared to the same three-month period in 2019 (Chart 1). Note Both violent crime and property crime were up during this time. From March to April 2020, the first full month of the pandemic and generally the month with the most country-wide restrictions in place, the number of police-reported crimes decreased 6%. The volume of crime reported during the month of April 2020 was 18% lower compared to April 2019.
Data table for Chart 1
| Month | Total Criminal Code (excluding traffic) - 2019 | Total Criminal Code (excluding traffic) - 2020 | Total violent crime - 2019 | Total violent crime - 2020 | Total property crime - 2019 | Total property crime - 2020 |
|---|---|---|---|---|---|---|
| number of incidents | ||||||
| January | 165,389 | 174,417 | 36,197 | 37,712 | 97,721 | 105,472 |
| February | 140,960 | 165,690 | 32,592 | 36,837 | 80,981 | 98,602 |
| March | 167,357 | 152,381 | 37,865 | 35,002 | 96,640 | 91,655 |
| April | 174,052 | 143,128 | 38,859 | 32,373 | 103,067 | 85,509 |
| May | 190,862 | 149,505 | 42,235 | 37,362 | 112,935 | 82,886 |
| June | 192,594 | 167,033 | 42,424 | 42,352 | 113,729 | 93,710 |
| July | 206,127 | 187,872 | 42,693 | 47,480 | 125,203 | 104,125 |
| August | 207,788 | 187,636 | 41,540 | 44,934 | 127,225 | 107,262 |
| September | 198,019 | 178,663 | 40,448 | 41,275 | 122,519 | 103,329 |
| October | 194,035 | 176,949 | 40,562 | 39,772 | 119,889 | 104,971 |
| November | 173,705 | 153,806 | 37,976 | 36,214 | 104,517 | 89,206 |
| December | 167,812 | 147,899 | 37,663 | 35,226 | 99,818 | 84,519 |
| Note: Total Criminal Code (excluding traffic) includes "other Criminal Code" offences not included in Total violent crime or Total property crime. Monthly data were not available for the Kativik Regional Police Force, Gesgapegiag Ameridian Police Service, La Salle Police Service, Canadian National Railway Police, St. Thomas Police Service and Windsor Police Service. Therefore, these police services were excluded from the monthly analysis. Source: Statistics Canada, Canadian Centre for Justice and Community Safety Statistics, Uniform Crime Reporting Survey. | ||||||
In recent years, crime was typically at its lowest in the first quarter of the year, specifically in January and February. Crime would then begin to increase to a peak in July and August, before dropping again in the fall and winter months (Chart 2). This pattern remained fairly similar in 2020, although overall crime levels were typically lower than the two previous years throughout the pandemic period from March to December. Comparing monthly data for 2020 with 2019, violent and non-violent crime showed relatively large decreases in March, April and May, while for the months of July (+11%), August (+8%) and September (+2%), violent crime increased above the pre-pandemic 2019 levels. This was largely the result of more incidents of assault (level 1 and 2), uttering threats and sexual assault (level 1) during the summer months.
Data table for Chart 2
| Year and month | Total Criminal Code (excluding traffic) | Total violent crime | Total property crime | Total drug offences | Total other Criminal Code offences | |
|---|---|---|---|---|---|---|
| number of incidents | ||||||
| 2018 | Jan. | 149,379 | 31,380 | 89,958 | 7,373 | 28,041 |
| Feb. | 134,322 | 29,746 | 79,353 | 6,189 | 25,223 | |
| Mar. | 155,848 | 33,928 | 91,975 | 8,153 | 29,945 | |
| Apr. | 155,291 | 32,698 | 93,411 | 8,018 | 29,182 | |
| May | 179,198 | 37,658 | 108,295 | 8,518 | 33,245 | |
| June | 179,804 | 37,137 | 109,133 | 7,506 | 33,534 | |
| July | 189,116 | 37,065 | 116,923 | 8,334 | 35,128 | |
| Aug. | 190,214 | 37,013 | 118,979 | 7,611 | 34,222 | |
| Sept. | 177,083 | 35,004 | 110,153 | 7,971 | 31,926 | |
| Oct. | 180,449 | 35,640 | 112,270 | 5,744 | 32,539 | |
| Nov. | 162,978 | 33,959 | 100,371 | 4,208 | 28,648 | |
| Dec. | 159,502 | 36,235 | 94,447 | 4,090 | 28,820 | |
| 2019 | Jan. | 165,389 | 36,197 | 97,721 | 5,579 | 31,471 |
| Feb. | 140,960 | 32,592 | 80,981 | 5,254 | 27,387 | |
| Mar. | 167,357 | 37,865 | 96,640 | 5,285 | 32,852 | |
| Apr. | 174,052 | 38,859 | 103,067 | 5,821 | 32,126 | |
| May | 190,862 | 42,235 | 112,935 | 6,046 | 35,692 | |
| June | 192,594 | 42,424 | 113,729 | 6,290 | 36,441 | |
| July | 206,127 | 42,693 | 125,203 | 6,287 | 38,231 | |
| Aug. | 207,788 | 41,540 | 127,225 | 6,349 | 39,023 | |
| Sept. | 198,019 | 40,448 | 122,519 | 6,496 | 35,052 | |
| Oct. | 194,035 | 40,562 | 119,889 | 6,061 | 33,584 | |
| Nov. | 173,705 | 37,976 | 104,517 | 5,162 | 31,212 | |
| Dec. | 167,812 | 37,663 | 99,818 | 4,182 | 30,331 | |
| 2020 | Jan. | 174,417 | 37,712 | 105,472 | 5,853 | 31,233 |
| Feb. | 165,690 | 36,837 | 98,602 | 5,383 | 30,251 | |
| Mar. | 152,381 | 35,002 | 91,655 | 4,622 | 25,724 | |
| Apr. | 143,128 | 32,373 | 85,509 | 5,323 | 25,246 | |
| May | 149,505 | 37,362 | 82,886 | 6,582 | 29,257 | |
| June | 167,033 | 42,352 | 93,710 | 5,699 | 30,971 | |
| July | 187,872 | 47,480 | 104,125 | 5,582 | 36,267 | |
| Aug. | 187,636 | 44,934 | 107,262 | 5,671 | 35,440 | |
| Sept. | 178,663 | 41,275 | 103,329 | 6,030 | 34,059 | |
| Oct. | 176,949 | 39,772 | 104,971 | 5,301 | 32,206 | |
| Nov. | 153,806 | 36,214 | 89,206 | 5,337 | 28,386 | |
| Dec. | 147,899 | 35,226 | 84,519 | 4,450 | 28,154 | |
| Note: Total Criminal Code (excluding traffic) includes Total violent crime, Total property crime and Total other Criminal Code offences; it excludes Total drug offences which are violations under the Controlled Drugs and Substances Act and the Cannabis Act. Monthly data were not available for the Kativik Regional Police Force, Gesgapegiag Ameridian Police Service, La Salle Police Service, Canadian National Railway Police, St. Thomas Police Service and Windsor Police Service. Therefore, these police services were excluded from the monthly analysis. Source: Statistics Canada, Canadian Centre for Justice and Community Safety Statistics, Uniform Crime Reporting Survey. | ||||||
Start of text box 2
To track information on selected types of Criminal Code violations Note during the COVID-19 pandemic, Statistics Canada began collecting preliminary monthly crime data in the early months of the pandemic from a subset of police services representing 71% of the Canadian population. At the same time, preliminary information was collected on selected calls for police service—that is, calls for help which may not be related to crime. Note
Alongside responding to criminal events, police perform many duties including responding to events that are directly related to public safety and well-being, otherwise referred to as “calls for service.”
Police services in this special study responded to 9% more selected calls for service during the pandemic months in 2020 (i.e., March to December 2020) than they did over the same period in 2019. In particular, the police services that were able to report data on these calls for service responded to more calls related to general well-being checks (+16%), mental health-related calls such as responses to a person in emotional crisis or apprehensions under the Mental Health Act (+13%), and domestic disturbances (+7%).
See Text box 3 for more detailed information on family violence during the pandemic.
Early data collected for 2021 from the same subset of police services indicate that crime was down 20% in the first quarter of 2021 compared to the first quarter of 2020. Note The month of April 2021, however, was 9% higher than April 2020, the first full month of the pandemic. Data for this project will continue to be collected on a monthly basis and released regularly.
See data table 35-10-0169-01 for more information. Note
End of text box 2
Decreases in property crime were the main contributors to the overall decline in crime in 2020. With stay-at-home orders and many individuals working remotely, most Canadians were not leaving their homes as often, increasing guardianship and reducing opportunities for some property crimes. Violations such as breaking and entering, shoplifting of $5,000 or under and theft of $5,000 or under experienced large decreases from 2019 to 2020 (Chart 3). Robbery, which is considered a violent offence because it involves the use or threat of violence during the commission of a theft, similarly experienced a large annual decrease (see Key terminology and definitions).

Data table for Chart 3
| Year | Breaking and entering | Robbery | Shoplifting of $5,000 or under | Theft of $5,000 or under |
|---|---|---|---|---|
| rate per 100,000 population | ||||
| 1998 | 1,163 | 109 | 303 | 2,063 |
| 1999 | 1,046 | 107 | 276 | 1,955 |
| 2000 | 956 | 100 | 262 | 1,899 |
| 2001 | 901 | 99 | 258 | 1,869 |
| 2002 | 879 | 96 | 257 | 1,871 |
| 2003 | 901 | 101 | 271 | 1,944 |
| 2004 | 864 | 97 | 240 | 1,871 |
| 2005 | 811 | 101 | 237 | 1,743 |
| 2006 | 772 | 106 | 245 | 1,652 |
| 2007 | 704 | 104 | 234 | 1,530 |
| 2008 | 635 | 97 | 238 | 1,425 |
| 2009 | 613 | 97 | 276 | 1,386 |
| 2010 | 579 | 90 | 268 | 1,286 |
| 2011 | 528 | 87 | 260 | 1,197 |
| 2012 | 508 | 80 | 264 | 1,175 |
| 2013 | 446 | 66 | 250 | 1,096 |
| 2014 | 429 | 59 | 265 | 1,069 |
| 2015 | 447 | 62 | 280 | 1,085 |
| 2016 | 444 | 61 | 285 | 1,091 |
| 2017 | 437 | 62 | 296 | 1,086 |
| 2018 | 433 | 61 | 337 | 1,100 |
| 2019 | 430 | 62 | 374 | 1,130 |
| 2020 | 362 | 51 | 239 | 904 |
| Note: Populations are based upon July 1 st estimates from Statistics Canada, Centre for Demography. Source: Statistics Canada, Canadian Centre for Justice and Community Safety Statistics, Uniform Crime Reporting Survey. | ||||
In 2020, the rate of breaking and entering declined 16% nationally to 362 incidents per 100,000 population. Since peaking in 1991, the police-reported rate of breaking and entering has generally been declining in Canada. Over the last decade, the rate of breaking and entering has fallen 38%. Despite this decrease, breaking and entering continued to be one of the more common forms of property crime; just over 137,500 incidents were reported by police in 2020, accounting for 12% of property crime, the same proportion as the previous year.
All provinces and territories reported declines in breaking and entering in 2020, with rates from 11% to 33% lower across the country (Table 2). Given its relatively high volume and CSI weight, changes in rates of breaking and entering had a measurable impact on CSI s in all jurisdictions (see Text box 7 and Text box 10). In 2020, 30 out of 35 census metropolitan areas (CMAs) Note reported decreases or no change in breaking and entering (Table 3).
Using incident characteristics, it is possible to analyze changes in the location of breaking and entering incidents. Residential and commercial breaking and entering made up the vast majority (92%) of police-reported breaking and entering incidents in 2020. Note From 2019 to 2020, the number of residential break and enters decreased 18%, while the number of commercial break and enters decreased 9%. Comparing the first three months of the pandemic (March, April and May 2020) to the same period in 2019, the number of residential break and enters decreased 18%, while commercial break and entering incidents were 9% higher. Therefore, there was an uptick in commercial breaking and entering during the early months of the pandemic relatively to the same period a year earlier. Additionally, the number of residential break and enters in 2020 decreased month-over-month (e.g., March 2020 compared with February 2020) in March (-4%), April (-6%) and May (-7%), before increasing in June (+10%), July (+8%) and August (+10%). Commercial break and enters, on the other hand, increased in March (+15%) and April (+6%), before decreasing in May (-37%) and June (-3%) (July had no change and August increased 18%).
National rates of police-reported robbery, which had remained fairly stable over the last five years, dropped 18% from 62 incidents per 100,000 to 51 incidents per 100,000. Rates of robbery declined in all provinces and territories with the exceptions of Nova Scotia (+11%) and Yukon (+3%), and rates declined or remained the same in 25 of 35 CMA s.
In 2020, as could be expected given the nation-wide restrictions put in place to contain the pandemic, such as the temporary closures of many businesses or moves toward curbside pickup, the rates of shoplifting and theft of $5,000 or under both dropped in all provinces and territories, and in almost all CMA s (Peterborough reported an increase in theft of $5,000 or under, while Barrie remained unchanged). While both violations are less severe relative to breaking and entering or robbery, the volume of these crimes contributed to their relatively large impact on the CSI across the country. In 2020, police-reported about 90,900 incidents of shoplifting of $5,000 or under, representing a rate of 239 per 100,000 population, 36% lower than in 2019. Similarly, the rate of other theft of $5,000 or under dropped 20% from 1,130 to 904.
In 2020, there were 28,639 police-reported sexual assaults (level 1, 2 and 3), or 75 incidents per 100,000 population (Table 1). This rate was 9% lower than in 2019, marking the first decrease in sexual assault following five years of increases. This was also the largest decrease since a 12% decline in 1995 (Chart 4). From 2019 to 2020, the rate of police-reported sexual assault (level 1, 2 and 3) decreased in most provinces and territories, with the exceptions of Newfoundland and Labrador (+9%), Nunavut (+7%) and Quebec (+2%) (Table 2). Note

Data table for Chart 4
| Year | Rate per 100,000 population |
|---|---|
| 1986 | 79 |
| 1987 | 85 |
| 1988 | 93 |
| 1989 | 98 |
| 1990 | 101 |
| 1991 | 108 |
| 1992 | 121 |
| 1993 | 121 |
| 1994 | 109 |
| 1995 | 96 |
| 1996 | 91 |
| 1997 | 90 |
| 1998 | 85 |
| 1999 | 78 |
| 2000 | 78 |
| 2001 | 78 |
| 2002 | 78 |
| 2003 | 74 |
| 2004 | 72 |
| 2005 | 73 |
| 2006 | 68 |
| 2007 | 65 |
| 2008 | 65 |
| 2009 | 62 |
| 2010 | 66 |
| 2011 | 64 |
| 2012 | 63 |
| 2013 | 60 |
| 2014 | 58 |
| 2015 | 59 |
| 2016 | 60 |
| 2017 | 68 |
| 2018 | 77 |
| 2019 | 82 |
| 2020 | 75 |
| Note: Populations are based upon July 1 st estimates from Statistics Canada, Centre for Demography. Source: Statistics Canada, Canadian Centre for Justice and Community Safety Statistics, Uniform Crime Reporting Survey. | |
Despite considerable public discussion of issues around sexual violence in recent years, the number of sexual assaults reported by police is likely a significant underestimation of the true extent of sexual assault in Canada, as these types of offences often go unreported to police. The most recently available self-reported data from the 2019 General Social Survey on Canadians’ Safety (Victimization) show that only 6% of sexual assault incidents experienced by Canadians aged 15 and older in the previous 12 months were brought to the attention of police (Cotter forthcoming 2021). Similarly, data from the 2018 Survey of Safety in Public and Private Spaces indicate that police were informed about the most serious incident of sexual assault reported by 5% of the women who were victims for sexual assault in the 12 months preceding the survey (Cotter and Savage 2019).
Pandemic-related lockdown conditions could have exacerbated issues around underreporting of sexual assaults. With widespread stay-at-home orders and overburdened hospital and medical care resources, it may be more difficult for victims to come forward to report instances of sexual assault, and less likely that a third-party (for example a doctor or teacher) would identify signs of abuse, particularly for children and youth. There are some indications that family violence services and victims of family violence may also have been disproportionately impacted by the pandemic (see Text box 3).
In 2020, just under one in ten (9%) level 1 sexual assaults reported to police were classified as unfounded, meaning it had been determined through police investigation that the incident reported did not occur, nor was it attempted. This represents a continued decrease in unfounded incidents from a high of 14% in 2017 (Table 4). For comparison, the proportion of common physical assault (level 1) classified as unfounded dropped from 11% in 2017 to 9% in 2020. For more detailed information on the potential impact of unfounded criminal incidents in previous years, refer to Text box 2 in Moreau 2020.
Start of text box 3
Starting in March 2020, many organizations within Canada and internationally raised concerns about increased domestic violence under lockdown restrictions brought in to address the COVID-19 pandemic (United Nations 2020; Vaeza 2020; WAGE 2021). Social isolation, loss of employment and reduced income may be factors that increase the risk of domestic violence and these conditions have been heightened since March 2020, particularly in periods with families confined at home, the closure of schools and child care facilities, and possible increased tension in the home.
In 2020, the overall rate of police-reported family violence remained unchanged from the previous year. Note In contrast, the rate of victims of non-family violence decreased 4% in 2020. Changes in the rates of family violence differed by age group. Rates for seniors increased for the fifth year in a row (+5%). The rate was also up in 2020 for adults aged 18 to 64 (+2%), continuing a four year upward trend. In contrast, after four years of increases, the police-reported rate of family violence among children decreased 5% between 2019 and 2020.
According to a web panel survey conducted in March 2020 asking Canadians how concerned they were about different situations, 10% of women and 6% of men reported that they were concerned about the possibility of violence in the home during the pandemic (Statistics Canada 2020b). A subsequent crowdsourcing initiative Note conducted in April 2020 echoed this finding as women were more likely than men to report being very or extremely concerned about the possibility of violence in the home during the pandemic (8.7% vs 6.5%) (Statistics Canada 2020c).
As in previous years, the majority (6 in 10) of victims of family violence in 2020 were living with the accused at the time of the incident, potentially exacerbated by stay-at-home orders and restrictions on mobility throughout the pandemic. In addition, for those experiencing violence, especially within the home, contacting police or accessing help may have been more difficult because of restricted contact with networks and sources of support, both formal (schools, counsellors, and victim services) and informal (family and friends). A detailed Statistics Canada report on family violence during the pandemic is planned for release in the Fall, 2021.
End of text box 3
While many police-reported crimes declined during the pandemic, the rate of police-reported child pornography Note increased 23% to 29 incidents per 100,000 population. This follows a 47% increase in 2019 and the rate has generally been trending upward since 2008 (Chart 5). Note Note In 2020, police reported 2,178 more incidents than in 2019 (Table 1). Circumstances of the pandemic have been noted as potentially exacerbating the conditions for victimization, especially with children and youth spending more time online (BC Gov News 2021; Public Safety Canada 2020). According to Cybertip.ca, Canada’s national tip line for reporting child sexual exploitation online, more than 4 million exploitation reports have been processed between 2002 and 2020, the vast majority of which were reported from 2017 onward (Cybertip 2021). Note

Data table for Chart 5
| Year | Rate per 100,000 population |
|---|---|
| 2008 | 4 |
| 2009 | 4 |
| 2010 | 5 |
| 2011 | 6 |
| 2012 | 6 |
| 2013 | 8 |
| 2014 | 11 |
| 2015 | 12 |
| 2016 | 18 |
| 2017 | 18 |
| 2018 | 16 |
| 2019 | 24 |
| 2020 | 29 |
| Note: Since 2015, reporting requirements for total child pornography include separate violations for accessing or possessing child pornography, and making or distributing child pornography, which, combined, make up total child pornography. Prior to 2015, different child pornography offences were reported simply as child pornography. Due to the complexity of these cyber incidents, the data likely reflect the number of active or closed investigations for the year rather than the total number of incidents reported to police. Data are based on police-reported incidents that are recorded in police services’ records management systems. The offence of “child pornography” includes offences under section 163.1 of the Criminal Code which makes it illegal to access, possess, make, print, or distribute child pornography. When the actual victim is not identified, this offence is reported to the Uniform Crime Reporting Survey with the most serious offence being “child pornography” which falls under the larger crime category of “other Criminal Code offences”. In cases where an actual victim is identified, police will report the most serious offence as sexual assault, sexual exploitation or other sexual violations against children, which fall under the category of “violent crimes” and child pornography may be reported as a secondary violation. Populations are based upon July 1 st estimates from Statistics Canada, Centre for Demography. Source: Statistics Canada, Canadian Centre for Justice and Community Safety Statistics, Uniform Crime Reporting Survey. | |
Among the provinces, most reported increases in the rate of child pornography incidents from 2019 to 2020, including Prince Edward Island (+4%), Nova Scotia (+55%), New Brunswick (+81%), Quebec (+30%), Ontario (+2%), Manitoba (+32%) and British Columbia (+44%). The majority of the national increase was due to more incidents in British Columbia (+1,465 incidents, +44% rate) and Quebec (+417 incidents, +30% rate).
Among the CMA s, Vancouver (+870 incidents), Montréal (+351 incidents), Winnipeg (+144 incidents) and Victoria (+129 incidents) reported the largest increases in the number of child pornography violations. Together, these four CMA s represented 75% of the increase in incidents in child pornography among CMA s from 2019 to 2020.
As in 2019, these particularly large increases in total child pornography incidents may be attributed in part to an increase in the number of cases forwarded to local police services by the RCMP ’s National Child Exploitation Coordination Centre (NCECC), which serves as the national law enforcement arm of the National Strategy for the Protection of Children from Sexual Exploitation on the Internet. In 2019, Public Safety Canada announced the expansion of the National Strategy with increased funding over three years to support awareness of online child sexual exploitation, reduce stigma of reporting, and increase Canada’s ability to pursue and prosecute offenders of sexual exploitation of children online (Public Safety Canada 2019a). Additionally, part of the increase in British Columbia could be the result of work initiated by the British Columbia Behavioural Sciences Group – Integrated Child Exploitation Unit (BSG) in 2014. The BSG uses software developed by the Child Rescue Coalition to identify computers located in the province that were used to access or share child pornography on the Internet, from which they could open an investigation (for more information on the software see Child Rescue Coalition 2020).
Another factor cited by police services that may have contributed to the increase in rates of total child pornography is the continued compliance with former Bill C-22 “An Act respecting the mandatory reporting of Internet child pornography by persons who provide an Internet service (2011).” Essentially, the Act requires that persons or entities providing an Internet service to the public must report known or suspected offences of child pornography to the police.
In 2020, there were over 7,200 cybercrime-related child pornography violations, up 35% from 5,375 violations in 2019. Note
According to the Public Health Agency of Canada (PHAC), the COVID-19 pandemic is worsening the ongoing public health crisis of opioid overdose deaths and hospitalizations. Between January 2016 and December 2020, PHAC reported 21,174 apparent opioid toxicity deaths occurred in Canada. In the first nine months following the implementation of COVID-19 prevention measures (April to December 2020), there were 5,148 opioid-related deaths, an 89% increase from the same period in 2019. Of all accidental apparent opioid toxicity deaths in 2020, 82% involved fentanyl or fentanyl analogues. Opioid-related deaths and hospitalizations have also been linked to the use of stimulants such as cocaine and methamphetamine, reflecting the polysubstance nature of the crisis (Special Advisory Committee on the Epidemic of Opioid Overdoses 2021). Note
A number of factors were cited as possible contributors to a worsening of the opioid overdose crisis during the pandemic, including the increasingly toxic drug supply, increased feelings of isolation, stress and anxiety and limited availability or accessibility of services for people who use drugs (Special Advisory Committee on the Epidemic of Opioid Overdoses 2021).
In 2020, there were 5,142 opioid-related offences in Canada, representing a rate of 14 per 100,000 population, a 34% increase compared to 2019 (Table 5). Note All opioid-related drug violations increased, including more possession, trafficking, production and importation or exportation offences (Table 6). Among the provinces, the highest rates were reported in British Columbia (54 per 100,000 population), Alberta (12) and Ontario (10) (Table 5). The CMA s with the highest rates of opioid-related offences were Kelowna (208 per 100,000 population) and Lethbridge (97), followed by Vancouver (43), Guelph (32), Abbotsford-Mission (31), Kitchener-Cambridge-Waterloo (30) and St. Catharines-Niagara (29). In terms of opioid-related deaths, Western Canada continues to be the most impacted region of the country since 2016, but rates have begun to increase in other areas as well, notably in Ontario (Special Advisory Committee on the Epidemic of Opioid Overdoses 2021).
Opioid-related offences were the only specific drug type to experience an increase in 2020 compared to 2019; police-reported rates of cannabis (-25%), heroin (-15%), ecstasy (-7%), methamphetamine (-5%) and cocaine-related drug offences (-2%) all decreased. Overall, police-reported rates of cocaine (40 incidents per 100,000 population), methamphetamine (37), cannabis (33) and opioid-related offences (14) were highest among the specific drug types (Table 5).
While the rates of these other drug types decreased, the polysubstance nature of the opioid crisis may impact how particular drug offences, namely those related to methamphetamine and cocaine, are reported, given that only one drug type will be indicated as the most serious violation for a particular criminal incident. According to data reported by PHAC from six provinces and territories, around half (52%) of accidental opioid toxicity deaths in 2020 also involved a stimulant. Of these deaths, 68% involved cocaine, while 47% involved methamphetamines. Similarly, 84% of deaths identified as apparent stimulant toxicity deaths also involved an opioid over the same time period.
Nationally, rates of police-reported cannabis offences continued to drop two years after the legalization of cannabis on October 17, 2018. The Cannabis Act provides a legal framework for the legalization and regulation of the production, distribution, sale, possession, importation and exportation of cannabis in Canada (Parliament of Canada 2018).
According to the National Cannabis Survey, in the fourth quarter of 2020, 20% of Canadians 15 years and older consumed cannabis in the three months preceding the survey, up 2% from the first quarter of 2019 (following legalization), and 6% from the first quarter of 2018 (prior to legalization). Over the same time period, the proportion of consumers who reported getting cannabis from a legal source rose from 23% to 68%, while the proportion who reported getting cannabis from an illegal source dropped from 51% to 35% (respondents could select more than one source, therefore the percentages do not add up to 100%). Furthermore, the number of legal retail cannabis stores in Canada increased nearly eightfold since the fourth quarter of 2018, from 182 stores to 1,445 (Rotermann 2021).
Since 2012, national police-reported rates of cannabis-related drug offences have been declining, with notable decreases from 2018 to 2020 (Chart 6). In 2020, there were just over 66,800 total drug offences reported by police, representing a rate of 176 per 100,000 population, of which cannabis-related drug offences accounted for 19% Note (Table 6). As would be expected following legalization, this is by far the lowest proportion of cannabis offences relative to all drug-related offences; from 1986 to 2015, cannabis offences accounted for, on average, 68% of all drug-related offences.

Data table for Chart 6
Cannabis includes cannabis offences under the Controlled Drugs and Substances Act (CDSA) and the Cannabis Act. As a result of the coming into force of the Cannabis Act on October 17, 2018, all prior cannabis-related legislation under the CDSA has been replaced with the Cannabis Act. Includes possession, trafficking, importation or exportation, production, distribution, sale, and "other" cannabis-violations.
Includes possession, trafficking, production, importation and exportation.
Includes heroin, methamphetamines (e.g., crystal meth), methylenedioxyamphetamine (e.g., ecstasy), opioids (including fentanyl, excluding heroin) and other controlled drugs and substances, as well as possession of precursors and equipment.
In 2020, the rate of cannabis-related incidents under the Cannabis Act and Controlled Drugs and Substances Act dropped 25% from the previous years. Note Police reported a total of 12,591 incidents, representing a rate of 33 incidents per 100,000 population. The most commonly reported offences were related to importation or exportation (61% of all Cannabis Act offences), possession (11%), and distribution (9%) (Table 6). By comparison, in 2018, prior to the legalization of cannabis, possession accounted for three-quarters (75%) of cannabis offences. Due to legalization under the Cannabis Act, possession is only illegal under certain circumstances.
In the first year of the pandemic, the rate of offences related to importation or exportation accounted for the largest decrease among Cannabis Act offences, dropping 31% from 29 incidents per 100,000 to 20 incidents per 100,000. In total, there were 3,211 fewer incidents of importation or exportation under the Cannabis Act in 2020. The Montréal CMA in Quebec accounted for the majority of the national decrease in importation or exportation offences reported under the Cannabis Act, decreasing 72% (4,180 fewer incidents) from 2019 to 2020. The large decrease in offences year-over-year was due in part to fewer postal seizures and seizures conducted by the Canada Border Services Agency in Montréal since the beginning of the COVID-19 pandemic. Additionally, the Vancouver CMA in British Columbia accounted for 56% of all importation or exportation offences reported under the Cannabis Act (4,194 of the 7,552 offences reported nationally). The high proportion of offences was due in part to seizure cases, conducted by the Canada Border Services Agency and the Canada Post Mail Centre in the Vancouver CMA , being forwarded for processing and investigation. As a result of this exchange, the year in which occurrences were reported by the Royal Canadian Mounted Police may not always correspond to the year in which they occurred.
Provincially, the rates of cannabis offences in British Columbia (102 per 100,000 population) and Quebec (42 per 100,000 population) were higher than the national rate (33 per 100,000 population) (Table 5). Historically, British Columbia reported the highest rates of cannabis-related drug offences under the CDSA legislation relative to the other provinces, while Quebec reported the second highest rates in 2017 and 2018.
In contrast to the fairly widespread declines in many types of crime in 2020, Canada saw continued increases in the rates of various criminally harassing and threatening behaviours. In particular, non-consensual distribution of intimate images (+229 incidents, +10% rate), uttering threats (+3,343 incidents, +3% rate), criminal harassment (+1,174 incidents, +4% rate per 100,000 population), and indecent or harassing communications (+2,471 incidents, +9% rate) all saw increases compared with 2019 (Table 1; Chart 7).

Data table for Chart 7
| Year | Uttering threats | Criminal harassment | Indecent or harassing communications | Non-consensual distribution of intimate images |
|---|---|---|---|---|
| rate per 100,000 population | ||||
| 2009 | 234 | 59 | 69 | Note . : not applicable |
| 2010 | 225 | 63 | 64 | Note . : not applicable |
| 2011 | 209 | 63 | 59 | Note . : not applicable |
| 2012 | 203 | 64 | 54 | Note . : not applicable |
| 2013 | 182 | 61 | 47 | Note . : not applicable |
| 2014 | 176 | 55 | 39 | Note . : not applicable |
| 2015 | 176 | 56 | 41 | 1 |
| 2016 | 169 | 53 | 42 | 2 |
| 2017 | 173 | 54 | 45 | 4 |
| 2018 | 180 | 53 | 48 | 4 |
| 2019 | 215 | 62 | 62 | 5 |
| 2020 | 221 | 64 | 68 | 6 |
| . not applicable Note: Indecent or harassing communications was amended in the Protecting Canadians from Online Crime Act: Bill C-13 (2015) to include all means of telecommunication, not only phone calls. Non-consensual distribution of intimate images is an offence created by the Protecting Canadians from Online Crime Act: Bill C-13 (2015), therefore only data from 2015 to 2020 is shown. Populations are based upon July 1 st estimates from Statistics Canada, Centre for Demography. Source: Statistics Canada, Canadian Centre for Justice and Community Safety Statistics, Uniform Crime Reporting Survey. | ||||
In addition to legislative amendments and new offences that came into force in 2015 by the former Bill-C13 “Protecting Canadians from Online Crime Act,” Note Note the national increases in harassing and threatening offences can be attributed, in part, to increases in the accessibility and use of the Internet and social media. In the context of the COVID-19 pandemic, individuals are using computers and the Internet more often for school, work and socializing, potentially affording more opportunities for criminal violations that do not require a physical presence. For instance, in 2020, there were over 14,900 cybercrime-related harassing and threatening behaviour violations, up 17% from 2019. Note The perceived anonymity of the Internet and social media can facilitate criminal harassment, uttering threats and indecent and harassing behaviours (Dhillon 2012; Perrin 2018). In addition, advancements in cell phone technology and the availability of cloud-based sharing platforms could have contributed to the increases seen in the non-consensual distribution of intimate images. Increased focus on the enforcement and reporting accuracy of cybercrime, and increased awareness of cybercrime by both the public and police may have also contributed to the change.
Start of text box 4
During the pandemic, various issues related to safety and discrimination were exposed and exacerbated in Canada, including hate crime. According to a crowdsourcing initiative Note conducted by Statistics Canada, in the early months of the pandemic, the proportion of participants designated as visible minorities who perceived an increase in race-based harassment or attacks was three times larger than the proportion among the rest of the population (18% versus 6%) (Statistics Canada 2020d). This difference was most pronounced among Chinese (30%), Korean (27%), and Southeast Asian (19%) participants.
Hate crimes target the integral and visible parts of a person's identity and may disproportionately affect the wider community. A hate crime incident may be carried out against a person or property and may target race, colour, national or ethnic origin, religion, sexual orientation, gender identity or expression, language, sex, age, mental or physical disability, or any other similar factor. In addition, four specific offences are listed as hate propaganda or hate crimes in the Criminal Code of Canada: advocating genocide, public incitement of hatred, willful promotion of hatred and mischief motivated by hate in relation to property used by an identifiable group.
The number of police-reported hate crimes in Canada increased by 37% in 2020, rising from 1,951 incidents to 2,669. This marks the largest number of police-reported hate crimes recorded since comparable data became available in 2009. Police-reported hate crimes targeting race or ethnicity almost doubled (+80%) compared with the previous year, accounting for the vast majority of the national increase in hate crimes. Ontario (+321 incidents targeting race or ethnicity), British Columbia (+196 incidents) and Alberta (+105 incidents) reported the biggest increases.
Much of the rise in police-reported hate crimes targeting race or ethnicity was the result of crimes targeting the Black population (+318 incidents or +92%), the East or Southeast Asian population Note (+202 incidents or +301%), the Indigenous population Note (+44 incidents or +152%), and the South Asian population Note (+38 incidents or +47%). In 2020, police reported the highest number of hate crimes targeting each of these populations since comparable data have been available.
Police-reported hate crimes targeting religion were down as a result of fewer incidents targeting the Muslim population (-100 incidents), Note while incidents targeting the Jewish population rose slightly (+15 incidents). Hate crimes targeting sexual orientation dropped slightly (-6 incidents) after a peak in 2019. Among all hate crimes, both non-violent (+42%) and violent (+30%) hate crimes increased in 2020.
Police data on hate crimes reflect only those incidents that come to the attention of police and that are subsequently classified as hate crimes. As a result, fluctuations in the number of reported incidents may be attributable to a true change in the volume of hate crimes, but they might also reflect changes in reporting by the public because of increased community outreach by police or heightened sensitivity after high-profile events.
A detailed analytical Juristat on police-reported hate crime in Canada for the year 2020 will be released in early 2022.
| Detailed motivation | 2018 | 2019 | 2020 | |||
|---|---|---|---|---|---|---|
| number | percent | number | percent | number | percent | |
| Race or ethnicity | 793 | 44 | 884 | 46 | 1,594 | 62 |
| Black | 295 | 16 | 345 | 18 | 663 | 26 |
| East or Southeast Asian | 60 | 3 | 67 | 4 | 269 | 11 |
| South Asian | 84 | 5 | 81 | 4 | 119 | 5 |
| Arab or West Asian | 93 | 5 | 125 | 7 | 123 | 5 |
| Indigenous (First Nations, Métis or Inuit) | 39 | 2 | 29 | 2 | 73 | 3 |
| White | 42 | 2 | 48 | 3 | 81 | 3 |
| Other race or ethnicity Text box 4 Note 1 | 163 | 9 | 150 | 8 | 193 | 8 |
| Race or ethnicity not specified | 17 | 1 | 39 | 2 | 73 | 3 |
| Religion | 657 | 37 | 613 | 32 | 515 | 20 |
| Jewish | 372 | 21 | 306 | 16 | 321 | 13 |
| Muslim | 166 | 9 | 182 | 10 | 82 | 3 |
| Catholic | 44 | 2 | 51 | 3 | 42 | 2 |
| Other religion Text box 4 Note 2 | 52 | 3 | 57 | 3 | 41 | 2 |
| Religion not specified | 23 | 1 | 17 | 1 | 29 | 1 |
| Sexual orientation | 186 | 10 | 265 | 14 | 259 | 10 |
| Other motivation Text box 4 Note 3 | 159 | 9 | 150 | 8 | 189 | 7 |
| Motivation unknown | 22 | Note . : not applicable | 39 | Note . : not applicable | 112 | Note . : not applicable |
| Total | 1,817 | 100 | 1,951 | 100 | 2,669 | 100 |
| . not applicable | ||||||
Includes motivations based upon race or ethnicity not otherwise stated (e.g., Latin American, South American) as well as hate crimes which target more than one race or ethnic group.
Includes motivations based upon religion not otherwise stated (e.g., Sikh, Hindu, Buddhist).
Includes mental or physical disability, language, sex or gender, age and other similar factors (e.g., occupation or political beliefs).
End of text box 4
The Criminal Code specifies a number of violent offences involving the use of a firearm, including discharging a firearm with intent, pointing a firearm and using a firearm in the commission of an indictable offence. Note More serious crimes, however, such as homicide, robbery, assault and sexual assault, may have also involved a firearm. To measure all violent firearm-related crime, information on the incident characteristics must be used. In 2020, there were 8,344 victims of violent crime where a firearm was present during the commission of the offence, or a rate of 29 per 100,000 population. Note This rate was unchanged compared to 2019 (29); since reaching its lowest point in recent years in 2013, firearm-related violent crime has generally been increasing, with the exception of a decline between 2017 and 2018. Note
Among violent offences involving the use of a firearm that are specified in the Criminal Code, 45% in 2020 were for discharging a firearm with intent, while another 40% were for pointing a firearm. The remaining 15% were for using a firearm in the commission of an indictable offence. The number of violent offences specific to firearms increased by 593 incidents in 2020 (from 3,544 in 2019 to 4,137 in 2020), resulting in a 15% rate increase (Table 1). This marks the sixth consecutive annual increase. Rates rose across all three violent firearm violations: discharging a firearm with intent (+21%, +339 incidents), pointing of a firearm (+14%, +227 incidents), and using a firearm in the commission of an indictable offence (+3%, +27 incidents). Much of the increase in firearm-related offences in 2020 was the result of more incidents in Alberta (+185), Quebec (+148) and Ontario (+132).
Additionally, the rate of non-violent weapons violations (e.g., possession of weapons and unsafe storage of firearms) has increased for the sixth consecutive year, rising 3% to 51 incidents per 100,000 population (Table 1). The vast majority (91%) of these violations were related to possession of weapons offences and breach offences for weapons possession contrary to an order.
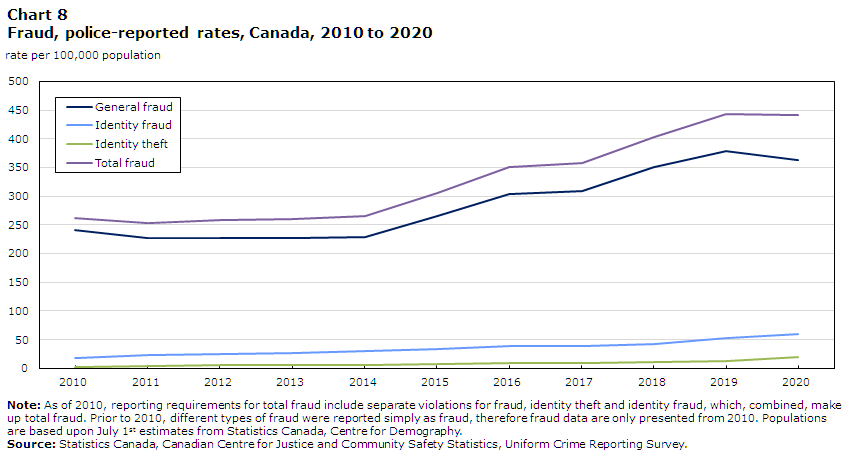
The rate of police-reported total fraud did not increase for the first time in nine years, remaining essentially stable (the rate was 443 per 100,000 population in 2019 and 442 in 2020); the rate was 69% higher than the rate reported a decade ago (Chart 8; Table 1). Note The overall stability was the result of offsetting changes in different types of fraud: general fraud, the most voluminous type of fraud, declined 4% from 2019 to 2020, while rates for identity fraud (+12%) and identity theft (+52%) increased.
Data table for Chart 8
| Year | General fraud | Identity fraud | Identity theft | Total fraud |
|---|---|---|---|---|
| rate per 100,000 population | ||||
| 2010 | 240 | 18 | 2 | 261 |
| 2011 | 226 | 23 | 4 | 254 |
| 2012 | 227 | 26 | 5 | 258 |
| 2013 | 227 | 27 | 6 | 260 |
| 2014 | 229 | 30 | 6 | 266 |
| 2015 | 264 | 33 | 7 | 305 |
| 2016 | 304 | 39 | 9 | 351 |
| 2017 | 310 | 39 | 9 | 358 |
| 2018 | 351 | 43 | 10 | 404 |
| 2019 | 378 | 53 | 13 | 443 |
| 2020 | 363 | 59 | 19 | 442 |
| Note: As of 2010, reporting requirements for total fraud include separate violations for fraud, identity theft and identity fraud, which, combined, make up total fraud. Prior to 2010, different types of fraud were reported simply as fraud, therefore fraud data are only presented from 2010. Populations are based upon July 1 st estimates from Statistics Canada, Centre for Demography. Source: Statistics Canada, Canadian Centre for Justice and Community Safety Statistics, Uniform Crime Reporting Survey. | ||||
Despite the dip in fraud, new or evolving scams continue to draw the attention of the Canadian Anti-fraud Centre (CAFC) and the news media, particularly those involving tax returns with the Canada Revenue Agency, COVID-19-related scams including Canada Emergency Response Benefit (CERB) scams, fake vaccines and fake test results, as well as other general online, telephone or text message scams ( CAFC 2021). A recent survey on cyber security during the pandemic shows that just over 4 in 10 Canadians (42%) experienced at least one type of cyber security incident since the beginning of the pandemic, including phishing attacks, malware, fraud, and hacked accounts (Statistics Canada 2020a). Of those who experienced a cyber security incident, less than one-third (29%) reported the incident to a relevant service provider, financial institution or credit card company, and just 5% of individuals reported the incident to an authority such as the police. According to the Canadian Anti-Fraud Centre, from March 2020 to May 2021, there were 19,610 victims and $7.4 million lost due to COVID-related fraud alone.
While fraud is not an especially severe crime in the CSI , it is a relatively high-volume crime, which contributed to making fraud, typically general fraud, an important driver of the CSI and Non-Violent CSI in several jurisdictions in Canada (see Text box 7 and Text box 10).
Among the provinces, Western Canada, the Prairies and Ontario reported decreases in the rate of total fraud, while Quebec and the Atlantic provinces (excluding Newfoundland and Labrador) reported increases (Table 2). In each province and territory, there was a year-over-year increase in at least one fraud sub-type. Total fraud decreased in 20 of 35 CMA s in 2020 (Table 3).
Start of text box 5
Early in the pandemic, in an effort to minimize the impact and spread of the virus, the Government of Canada enacted regulatory amendments under the Contraventions Act. These amendments allow law enforcement agencies to issue tickets to individuals who do not comply with orders under the Quarantine Act. Note In 2020, police reported 931 incidents under the Quarantine Act. The majority of these incidents were reported in British Columbia (348 incidents), Ontario (231 incidents), Alberta (156 incidents) and Quebec (90 incidents).
As a complementary measure to police-reported violations of the Quarantine Act, the Public Health Agency of Canada (PHAC) has been forwarding referrals for compliance verification to the Royal Canadian Mounted Police (RCMP). To limit the spread of COVID-19, the Government of Canada implemented emergency orders in March 2020 requiring a mandatory 14-day quarantine or isolation for all travellers entering Canada. From April 1, 2020 to June 28, 2021, according to data from PHAC , the agency had sent the RCMP 110,831 high priority referrals for compliance verification, based on police capacity and resources. This resulted in 102,483 law enforcement follow-ups that were reported to the Agency by June 28. Enforcement actions have resulted in 2,871 fines for offences under the Quarantine Act, and 16 court summons for charges laid under the Quarantine Act.
Prior to COVID-19, Canadian criminal courts were experiencing challenges with timely case processing, resulting in a Supreme Court of Canada decision (R. v. Jordan 2016) which set out new timelines for case completion (R. v. Jordan 2016, Karam et al. 2020). As a result of the COVID-19 pandemic, many courts across the country were unable to continue operating at normal capacity, which in some cases caused lengthy delays. Delays can have an adverse impact on persons accused of committing a crime, as well as offenders, victims and witnesses (Statistics Canada 2021a).
Additionally, the Canadian custodial population saw an unprecedented decrease during the early months of the pandemic (Statistics Canada 2021b). While balancing public safety concerns, reducing the number of persons held in correctional institutions was seen as a preventive measure to reduce the public health risk associated with COVID-19 transmission for those in custody and correctional staff. During March and April 2020, the first months of the COVID-19 pandemic, there was a historic decline of 15% in the number of adults in Canadian correctional institutions. In May and June 2020, the declines slowed, and from July to November, the average daily count of adults in custody increased slightly every month. In December, when confirmed COVID-19 cases in Canada were on the rise during a second wave of infections, the average daily count of adults in custody decreased slightly (-2%) (Statistics Canada 2021b).
Potentially as a consequence of the reduced activity in Canadian courts and corrections, the rate of administration of justice violations Note declined 17% in 2020, after having increased each of the previous five years. The majority of administration of justice violations are for failure to comply with an order (63%), breach of probation (20%) and failure to appear (11%). The rates of all three violations decreased substantially: failure to appear (-42%), breach of probation (-23%), and failure to comply with an order (-6%).
End of text box 5
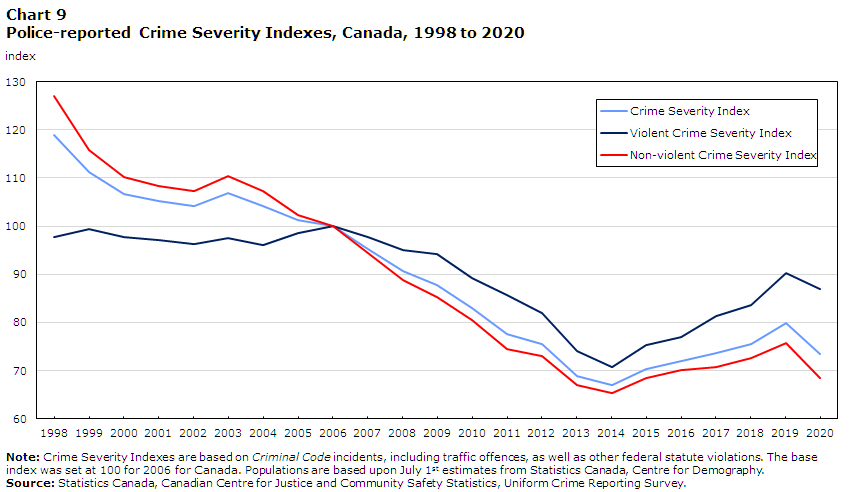
The Crime Severity Index (CSI) measures both the volume and severity of police-reported crime in Canada and has a base index value of 100 for 2006 (Text box 5). The CSI dropped 8% from 79.8 in 2019 to 73.4 in 2020, the first decrease following five years of increases (Table 7; Chart 9). Between 1998 and 2014, however, the CSI had steadily declined, with the exception of a 3% increase reported in 2003. The 2020 CSI was 11% lower than a decade prior.
Data table for Chart 9
| Year | Crime Severity Index | Violent Crime Severity Index | Non-violent Crime Severity Index |
|---|---|---|---|
| index | |||
| 1998 | 118.8 | 97.8 | 126.9 |
| 1999 | 111.2 | 99.4 | 115.8 |
| 2000 | 106.7 | 97.8 | 110.2 |
| 2001 | 105.3 | 97.2 | 108.4 |
| 2002 | 104.1 | 96.2 | 107.2 |
| 2003 | 106.8 | 97.6 | 110.4 |
| 2004 | 104.1 | 96.0 | 107.2 |
| 2005 | 101.3 | 98.5 | 102.4 |
| 2006 | 100.0 | 100.0 | 100.0 |
| 2007 | 95.3 | 97.8 | 94.3 |
| 2008 | 90.6 | 95.1 | 88.9 |
| 2009 | 87.8 | 94.3 | 85.3 |
| 2010 | 82.9 | 89.2 | 80.5 |
| 2011 | 77.6 | 85.7 | 74.5 |
| 2012 | 75.5 | 82.0 | 73.0 |
| 2013 | 68.9 | 74.0 | 66.9 |
| 2014 | 66.9 | 70.7 | 65.4 |
| 2015 | 70.4 | 75.3 | 68.4 |
| 2016 | 72.0 | 76.9 | 70.1 |
| 2017 | 73.6 | 81.3 | 70.7 |
| 2018 | 75.6 | 83.6 | 72.6 |
| 2019 | 79.8 | 90.3 | 75.8 |
| 2020 | 73.4 | 87.0 | 68.4 |
| Note: Crime Severity Indexes are based on Criminal Code incidents, including traffic offences, as well as other federal statute violations. The base index was set at 100 for 2006 for Canada. Populations are based upon July 1 st estimates from Statistics Canada, Centre for Demography. Source: Statistics Canada, Canadian Centre for Justice and Community Safety Statistics, Uniform Crime Reporting Survey. | |||
The first year of the pandemic was marked by widespread changes to how people live, work and interact with others as a result of varying lockdowns, stay-at-home orders and other restrictions. The 8% decline in the CSI in 2020 was driven by decreases in police-reported rates for numerous offences, primarily those related to property crime. Most notably, there were decreases in police-reported breaking and entering, theft of $5,000 or under, Note robbery, shoplifting of $5,000 or under, administration of justice violations and sexual assault (level 1).
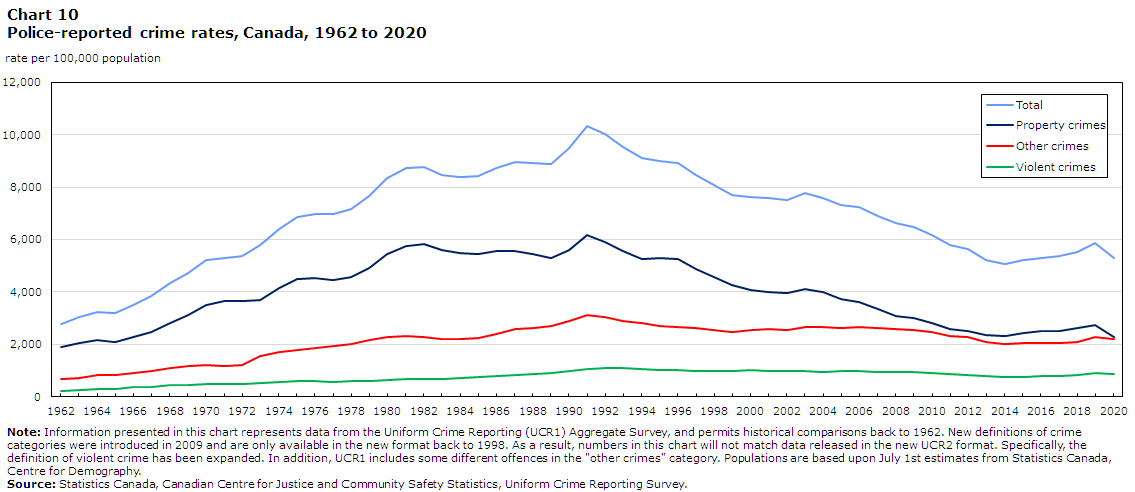
At 5,301 incidents per 100,000 population, the police-reported crime rate—which measures the volume of crime per 100,000 population—decreased 10% in 2020 (Table 8; Chart 10).
Data table for Chart 10
| Year | Total | Property crimes | Other crimes | Violent crimes |
|---|---|---|---|---|
| rate per 100,000 population | ||||
| 1962 | 2,771 | 1,891 | 659 | 221 |
| 1963 | 3,022 | 2,047 | 726 | 249 |
| 1964 | 3,245 | 2,146 | 815 | 284 |
| 1965 | 3,199 | 2,091 | 809 | 299 |
| 1966 | 3,511 | 2,258 | 907 | 347 |
| 1967 | 3,850 | 2,484 | 985 | 381 |
| 1968 | 4,336 | 2,826 | 1,087 | 423 |
| 1969 | 4,737 | 3,120 | 1,164 | 453 |
| 1970 | 5,212 | 3,515 | 1,217 | 481 |
| 1971 | 5,311 | 3,649 | 1,170 | 492 |
| 1972 | 5,355 | 3,634 | 1,224 | 497 |
| 1973 | 5,773 | 3,704 | 1,546 | 524 |
| 1974 | 6,388 | 4,151 | 1,684 | 553 |
| 1975 | 6,852 | 4,498 | 1,769 | 585 |
| 1976 | 6,984 | 4,533 | 1,867 | 584 |
| 1977 | 6,971 | 4,466 | 1,933 | 572 |
| 1978 | 7,154 | 4,579 | 1,995 | 580 |
| 1979 | 7,666 | 4,903 | 2,153 | 610 |
| 1980 | 8,343 | 5,444 | 2,263 | 636 |
| 1981 | 8,736 | 5,759 | 2,322 | 654 |
| 1982 | 8,773 | 5,840 | 2,262 | 671 |
| 1983 | 8,470 | 5,608 | 2,182 | 679 |
| 1984 | 8,387 | 5,501 | 2,185 | 701 |
| 1985 | 8,413 | 5,451 | 2,227 | 735 |
| 1986 | 8,727 | 5,550 | 2,392 | 785 |
| 1987 | 8,957 | 5,553 | 2,575 | 829 |
| 1988 | 8,919 | 5,439 | 2,613 | 868 |
| 1989 | 8,892 | 5,289 | 2,692 | 911 |
| 1990 | 9,485 | 5,612 | 2,900 | 973 |
| 1991 | 10,342 | 6,160 | 3,122 | 1,059 |
| 1992 | 10,040 | 5,904 | 3,052 | 1,084 |
| 1993 | 9,538 | 5,575 | 2,881 | 1,082 |
| 1994 | 9,125 | 5,257 | 2,821 | 1,047 |
| 1995 | 9,008 | 5,292 | 2,707 | 1,009 |
| 1996 | 8,932 | 5,274 | 2,656 | 1,002 |
| 1997 | 8,475 | 4,880 | 2,603 | 993 |
| 1998 | 8,093 | 4,569 | 2,529 | 995 |
| 1999 | 7,695 | 4,276 | 2,449 | 971 |
| 2000 | 7,610 | 4,081 | 2,534 | 996 |
| 2001 | 7,592 | 4,004 | 2,593 | 995 |
| 2002 | 7,516 | 3,976 | 2,560 | 980 |
| 2003 | 7,773 | 4,125 | 2,670 | 978 |
| 2004 | 7,601 | 3,976 | 2,668 | 957 |
| 2005 | 7,326 | 3,744 | 2,620 | 962 |
| 2006 | 7,246 | 3,605 | 2,673 | 968 |
| 2007 | 6,908 | 3,335 | 2,621 | 952 |
| 2008 | 6,632 | 3,096 | 2,598 | 938 |
| 2009 | 6,462 | 3,005 | 2,531 | 926 |
| 2010 | 6,160 | 2,802 | 2,451 | 907 |
| 2011 | 5,781 | 2,586 | 2,325 | 870 |
| 2012 | 5,639 | 2,524 | 2,272 | 843 |
| 2013 | 5,207 | 2,348 | 2,089 | 769 |
| 2014 | 5,062 | 2,328 | 1,998 | 736 |
| 2015 | 5,232 | 2,437 | 2,040 | 755 |
| 2016 | 5,298 | 2,490 | 2,039 | 769 |
| 2017 | 5,375 | 2,523 | 2,060 | 791 |
| 2018 | 5,513 | 2,625 | 2,068 | 819 |
| 2019 | 5,878 | 2,734 | 2,259 | 886 |
| 2020 | 5,301 | 2,265 | 2,193 | 843 |
| Note: Information presented in this chart represents data from the Uniform Crime Reporting (UCR1) Aggregate Survey, and permits historical comparisons back to 1962. New definitions of crime categories were introduced in 2009 and are only available in the new format back to 1998. As a result, numbers in this chart will not match data released in the new UCR 2 format. Specifically, the definition of violent crime has been expanded. In addition, UCR 1 includes some different offences in the "other crimes" category. Populations are based upon July 1 st estimates from Statistics Canada, Centre for Demography. Source: Statistics Canada, Canadian Centre for Justice and Community Safety Statistics, Uniform Crime Reporting Survey. | ||||
Canadian police services reported just over 2 million Criminal Code incidents (excluding traffic) in 2020, about 195,000 fewer incidents than in 2019. In addition, there were about 125,200 Criminal Code traffic offences, about 66,800 CDSA and Cannabis Act offences, and about 18,800 other federal statute violations (such as offences under the Youth Criminal Justice Act and the Customs Act) recorded by police in 2020. In total, there were over 2.2 million police-reported Criminal Code and “other federal statute” violations in 2020.
Although the CSI and the crime rate are separate measures, with the CSI accounting not only for volume but also changes in the relative severity of police-reported crime (Text box 6), both measures show similar trends in police-reported crime in Canada since 1998.
Start of text box 6
In Canada, there are two complementary ways to measure police-reported crime: the traditional crime rate and the Crime Severity Index (CSI). While both measures take into account the volume of police-reported crime, the CSI also accounts for the severity of crime. Both the traditional crime rate and the CSI measure crime based on the most serious violation in the criminal incident (see “Survey description” for more details). The most serious violation is determined by criteria in the following order of priority: violations against a person take precedence over violations not against a person, the greatest maximum penalty prescribed by law, violations causing death take precedence over other violations with the same maximum penalty and—if the above rules do not break a tie—the police service uses discretion to determine which is the most serious violation in the incident. Note
To publish the most timely police-reported crime statistics, this article relies on aggregate data (totals), which are the first crime data available each calendar year. More detailed data on the characteristics of incidents, victims and accused persons will be available following the release of this article, and data will be accessible for custom requests or possible inclusion in future editions of Juristat.
The traditional crime rate has been used to measure police-reported crime in Canada since 1962, and it is generally expressed as a rate per 100,000 population. The crime rate is calculated by summing all Criminal Code incidents reported by the police and dividing by the population count. The crime rate excludes Criminal Code traffic violations, as well as other federal statute violations such as drug offences.
To calculate the traditional police-reported crime rate, all offences are counted equally, regardless of their severity. For example, one incident of homicide is counted as equivalent to one incident of theft. As such, one limitation of the traditional crime rate is that it can easily fluctuate as a result of variations in higher volume but less serious offences, such as theft of $5,000 or under and mischief. In other words, a large decline in common but less serious violations may cause the police-reported crime rate to decrease even when the number of more serious but lower volume offences, such as homicide and robbery, increased.
In addition to the overall crime rate, rates are calculated for violent crime, property crime and other Criminal Code offences. Further, the rates of youth who have either been charged by police or dealt with through the use of extrajudicial measures are available for all crime categories.
The CSI was developed to address the limitation of the police-reported crime rate being driven by high-volume, but relatively less serious, offences. The CSI not only takes into account the volume of crime, but also the relative severity of crime. As such, the CSI will vary when changes in either the volume of crime or the average severity of crime—or both the volume and the average severity—are recorded.
In order to calculate the police-reported CSI , each violation is assigned a weight. CSI weights are based on the violation’s incarceration rate, as well as the average length of prison sentence handed down by criminal courts. Note The more serious the average sentence, the higher the weight assigned to the offence, meaning that the more serious offences have a greater impact on the CSI . Unlike the traditional crime rate, all offences, including Criminal Code traffic violations and other federal statute violations such as drug offences, are included in the CSI .
To calculate the CSI , the weighted offences are summed and then divided by the population. Similar to other indexes (e.g., Consumer Price Index), to allow for ease of comparison, the CSI is then standardized to a base year of “100” (for the CSI , the base year is 2006). All CSI values are relative to the Canada-level CSI for 2006. CSI values are available back to 1998.
In addition to the overall CSI , both a Violent CSI (VCSI) and a Non-violent CSI (NVCSI) have been created, which—like the overall CSI —are available back to 1998. The VCSI is comprised of all police-reported violent violations, and the NVCSI is comprised of all police-reported property violations, other Criminal Code violations, Criminal Code traffic violations, and other federal statute violations. All types of CSI measures are also available for youth who have been accused of a crime (charged and not charged).
To adjust to changes in sentencing patterns from the courts, and amendments to the Criminal Code and other federal statutes, the weights are updated every five years. The most recent update was carried out in 2018 and applies to 2019 revised and 2020 data presented in this article.
For more information on the CSI , see Measuring Crime in Canada: Introducing the Crime Severity Index and Improvements to the Uniform Crime Reporting Survey (Wallace et al. 2009), The Methodology of the Police-reported Crime Severity Index (Babyak et al. 2009), Updating the Police-Reported Crime Severity Index Weights: Refinements to the Methodology (Babyak et al. 2013), Updating the Police-Reported Crime Severity Index: Calculating 2018 Weights (Cormack and Tabuchi 2020), and the Measuring Crime in Canada: A detailed look at the Crime Severity Index video (Statistics Canada 2016).
End of text box 6
Between 2019 and 2020, 8 of Canada’s 10 provinces, and 1 territory (Nunavut) reported decreases in their CSI (Table 9). Nova Scotia (+8%) and New Brunswick (+3%) reported increases in their CSI . Approximately 40% of the increase in Nova Scotia was due to the mass shooting in Nova Scotia which ended in 22 lives lost and 3 people injured. Note As has been the case since 1998, the Prairie provinces and British Columbia have had the highest CSI s among the provinces, while the three Territories have reported the highest CSI s overall. Note Breaking and entering, theft and shoplifting of $5,000 or under, robbery, fraud and homicide offences were common contributing factors for increases or decreases in CSI s among the provinces and territories (Text box 7).
Start of text box 7
In April 2020, 22 people were killed and 3 others were injured in a mass shooting in Nova Scotia, marking the deadliest mass shooting in Canadian history. This event has impacted the crime severity index at the provincial and national level.
The Montréal CMA in Quebec accounted for the majority of the national decrease in importation or exportation offences reported under the Cannabis Act, decreasing 72% (4,180 fewer incidents) from 2019 to 2020. The large decrease in offences year-over-year was due in part to fewer postal seizures and seizures conducted by the Canada Border Services Agency in Montréal since the beginning of the COVID-19 pandemic. Additionally, the Vancouver CMA in British Columbia accounted for 56% of all importation or exportation offences reported under the Cannabis Act (4,194 of the 7,552 offences reported nationally). The high proportion of offences was due in part to seizure cases, conducted by the Canada Border Services Agency and the Canada Post Mail Centre in the Vancouver CMA , being forwarded for processing and investigation. As a result of this exchange, the year in which occurrences were reported by the Royal Canadian Mounted Police may not always correspond to the year in which they occurred.
End of text box 7
Most provinces reported a lower CSI and crime rate in 2020 than in 2010 (Table 9 and Table 10; Charts 11 to 14).

Data table for Chart 11
| Year | Newfoundland and Labrador | Prince Edward Island | Nova Scotia | New Brunswick | Canada |
|---|---|---|---|---|---|
| Crime Severity Index | |||||
| 1998 | 76.4 | 73.3 | 105.4 | 90.0 | 118.8 |
| 1999 | 69.2 | 79.0 | 104.6 | 90.0 | 111.2 |
| 2000 | 70.1 | 76.3 | 95.3 | 84.8 | 106.7 |
| 2001 | 69.1 | 75.4 | 92.5 | 83.4 | 105.3 |
| 2002 | 71.4 | 85.2 | 93.9 | 84.6 | 104.1 |
| 2003 | 74.4 | 91.0 | 101.4 | 87.8 | 106.8 |
| 2004 | 79.3 | 81.9 | 106.7 | 87.9 | 104.1 |
| 2005 | 78.5 | 76.8 | 102.1 | 79.5 | 101.3 |
| 2006 | 73.1 | 71.8 | 101.1 | 74.2 | 100.0 |
| 2007 | 75.3 | 64.1 | 91.9 | 70.8 | 95.3 |
| 2008 | 71.1 | 68.7 | 84.2 | 71.8 | 90.6 |
| 2009 | 71.5 | 66.4 | 84.0 | 70.7 | 87.8 |
| 2010 | 78.7 | 66.4 | 83.6 | 69.2 | 82.9 |
| 2011 | 71.9 | 67.3 | 79.5 | 66.2 | 77.6 |
| 2012 | 68.0 | 73.6 | 76.9 | 68.0 | 75.5 |
| 2013 | 68.5 | 65.3 | 70.1 | 60.0 | 68.9 |
| 2014 | 62.4 | 55.8 | 66.8 | 56.0 | 66.9 |
| 2015 | 65.8 | 50.6 | 63.3 | 62.4 | 70.4 |
| 2016 | 69.6 | 49.3 | 62.3 | 61.6 | 72.0 |
| 2017 | 63.5 | 45.9 | 66.3 | 68.8 | 73.6 |
| 2018 | 64.9 | 54.2 | 65.6 | 73.0 | 75.6 |
| 2019 | 71.9 | 64.3 | 66.5 | 80.3 | 79.8 |
| 2020 | 68.9 | 57.2 | 71.7 | 82.8 | 73.4 |
| Note: The Crime Severity Index is based on Criminal Code incidents, including traffic offences, as well as other federal statute violations. The base index was set at 100 for 2006 for Canada. Populations are based upon July 1 st estimates from Statistics Canada, Centre for Demography. Source: Statistics Canada, Canadian Centre for Justice and Community Safety Statistics, Uniform Crime Reporting Survey. | |||||
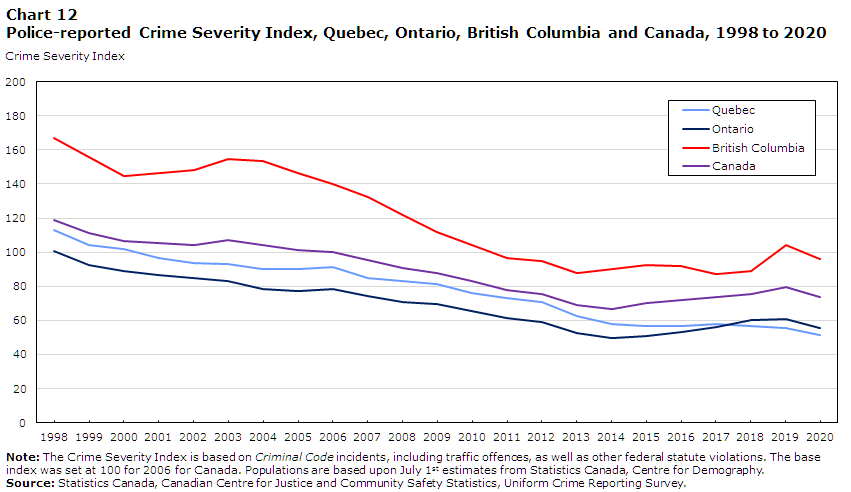
Data table for Chart 12
| Year | Quebec | Ontario | British Columbia | Canada |
|---|---|---|---|---|
| Crime Severity Index | ||||
| 1998 | 112.7 | 100.7 | 166.9 | 118.8 |
| 1999 | 104.3 | 92.3 | 155.8 | 111.2 |
| 2000 | 101.8 | 89.0 | 144.7 | 106.7 |
| 2001 | 96.6 | 86.5 | 146.6 | 105.3 |
| 2002 | 93.5 | 84.5 | 148.1 | 104.1 |
| 2003 | 92.9 | 83.2 | 154.7 | 106.8 |
| 2004 | 90.3 | 78.2 | 153.4 | 104.1 |
| 2005 | 89.9 | 77.0 | 146.3 | 101.3 |
| 2006 | 91.0 | 78.6 | 139.8 | 100.0 |
| 2007 | 84.7 | 74.5 | 132.4 | 95.3 |
| 2008 | 83.0 | 70.9 | 121.8 | 90.6 |
| 2009 | 81.5 | 69.3 | 111.9 | 87.8 |
| 2010 | 76.0 | 65.6 | 104.1 | 82.9 |
| 2011 | 73.4 | 61.2 | 96.7 | 77.6 |
| 2012 | 70.7 | 59.0 | 94.5 | 75.5 |
| 2013 | 62.7 | 52.6 | 87.7 | 68.9 |
| 2014 | 57.7 | 49.9 | 90.2 | 66.9 |
| 2015 | 57.0 | 51.1 | 92.7 | 70.4 |
| 2016 | 56.6 | 53.3 | 91.7 | 72.0 |
| 2017 | 57.8 | 56.4 | 87.1 | 73.6 |
| 2018 | 56.5 | 60.4 | 88.8 | 75.6 |
| 2019 | 55.8 | 61.0 | 104.4 | 79.8 |
| 2020 | 51.6 | 55.7 | 95.7 | 73.4 |
| Note: The Crime Severity Index is based on Criminal Code incidents, including traffic offences, as well as other federal statute violations. The base index was set at 100 for 2006 for Canada. Populations are based upon July 1 st estimates from Statistics Canada, Centre for Demography. Source: Statistics Canada, Canadian Centre for Justice and Community Safety Statistics, Uniform Crime Reporting Survey. | ||||

Data table for Chart 13
| Year | Manitoba | Saskatchewan | Alberta | Canada |
|---|---|---|---|---|
| Crime Severity Index | ||||
| 1998 | 154.5 | 176.2 | 122.5 | 118.8 |
| 1999 | 152.6 | 167.3 | 118.8 | 111.2 |
| 2000 | 149.5 | 169.4 | 111.3 | 106.7 |
| 2001 | 152.5 | 176.4 | 114.8 | 105.3 |
| 2002 | 148.3 | 175.7 | 116.3 | 104.1 |
| 2003 | 161.3 | 199.5 | 124.8 | 106.8 |
| 2004 | 163.3 | 192.3 | 124.1 | 104.1 |
| 2005 | 156.7 | 181.3 | 121.9 | 101.3 |
| 2006 | 155.9 | 170.5 | 115.6 | 100.0 |
| 2007 | 150.8 | 164.7 | 114.4 | 95.3 |
| 2008 | 129.9 | 152.5 | 112.0 | 90.6 |
| 2009 | 137.7 | 149.5 | 105.6 | 87.8 |
| 2010 | 127.3 | 148.2 | 98.2 | 82.9 |
| 2011 | 116.0 | 143.6 | 87.5 | 77.6 |
| 2012 | 114.5 | 138.8 | 86.1 | 75.5 |
| 2013 | 100.7 | 126.5 | 85.3 | 68.9 |
| 2014 | 96.7 | 125.0 | 87.6 | 66.9 |
| 2015 | 106.3 | 138.3 | 104.5 | 70.4 |
| 2016 | 115.4 | 151.4 | 106.0 | 72.0 |
| 2017 | 119.0 | 143.2 | 112.1 | 73.6 |
| 2018 | 126.2 | 140.7 | 113.7 | 75.6 |
| 2019 | 139.7 | 149.6 | 120.2 | 79.8 |
| 2020 | 125.2 | 141.1 | 107.4 | 73.4 |
| Note: The Crime Severity Index is based on Criminal Code incidents, including traffic offences, as well as other federal statute violations. The base index was set at 100 for 2006 for Canada. Populations are based upon July 1 st estimates from Statistics Canada, Centre for Demography. Source: Statistics Canada, Canadian Centre for Justice and Community Safety Statistics, Uniform Crime Reporting Survey. | ||||
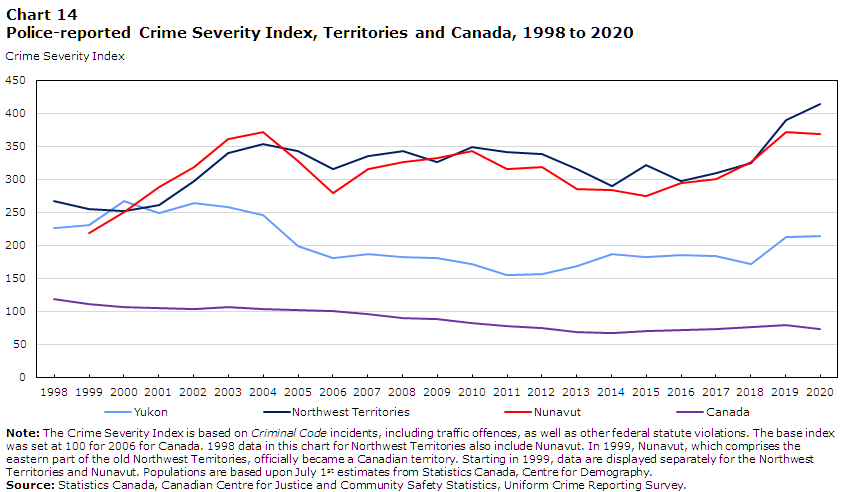
Data table for Chart 14
| Year | Yukon | Northwest Territories | Nunavut | Canada |
|---|---|---|---|---|
| Crime Severity Index | ||||
| 1998 | 226.2 | 267.5 | Note . : not applicable | 118.8 |
| 1999 | 230.4 | 255.4 | 218.8 | 111.2 |
| 2000 | 267.7 | 251.9 | 250.3 | 106.7 |
| 2001 | 248.8 | 260.4 | 288.9 | 105.3 |
| 2002 | 263.9 | 297.2 | 318.5 | 104.1 |
| 2003 | 258.7 | 339.4 | 360.8 | 106.8 |
| 2004 | 245.4 | 353.3 | 372.1 | 104.1 |
| 2005 | 199.4 | 343.3 | 327.1 | 101.3 |
| 2006 | 180.4 | 316.0 | 279.9 | 100.0 |
| 2007 | 186.3 | 335.8 | 316.0 | 95.3 |
| 2008 | 182.8 | 342.9 | 326.5 | 90.6 |
| 2009 | 180.9 | 326.2 | 332.9 | 87.8 |
| 2010 | 171.0 | 348.1 | 343.1 | 82.9 |
| 2011 | 154.7 | 342.0 | 315.1 | 77.6 |
| 2012 | 156.0 | 338.1 | 318.2 | 75.5 |
| 2013 | 169.4 | 315.0 | 286.0 | 68.9 |
| 2014 | 187.3 | 290.2 | 283.7 | 66.9 |
| 2015 | 183.0 | 321.9 | 275.2 | 70.4 |
| 2016 | 185.9 | 297.4 | 294.9 | 72.0 |
| 2017 | 183.7 | 309.5 | 300.5 | 73.6 |
| 2018 | 171.7 | 325.3 | 325.5 | 75.6 |
| 2019 | 212.1 | 389.4 | 371.6 | 79.8 |
| 2020 | 214.5 | 414.5 | 368.4 | 73.4 |
| . not applicable Note: The Crime Severity Index is based on Criminal Code incidents, including traffic offences, as well as other federal statute violations. The base index was set at 100 for 2006 for Canada. 1998 data in this chart for Northwest Territories also include Nunavut. In 1999, Nunavut, which comprises the eastern part of the old Northwest Territories, officially became a Canadian territory. Starting in 1999, data are displayed separately for the Northwest Territories and Nunavut. Populations are based upon July 1 st estimates from Statistics Canada, Centre for Demography. Source: Statistics Canada, Canadian Centre for Justice and Community Safety Statistics, Uniform Crime Reporting Survey. | ||||
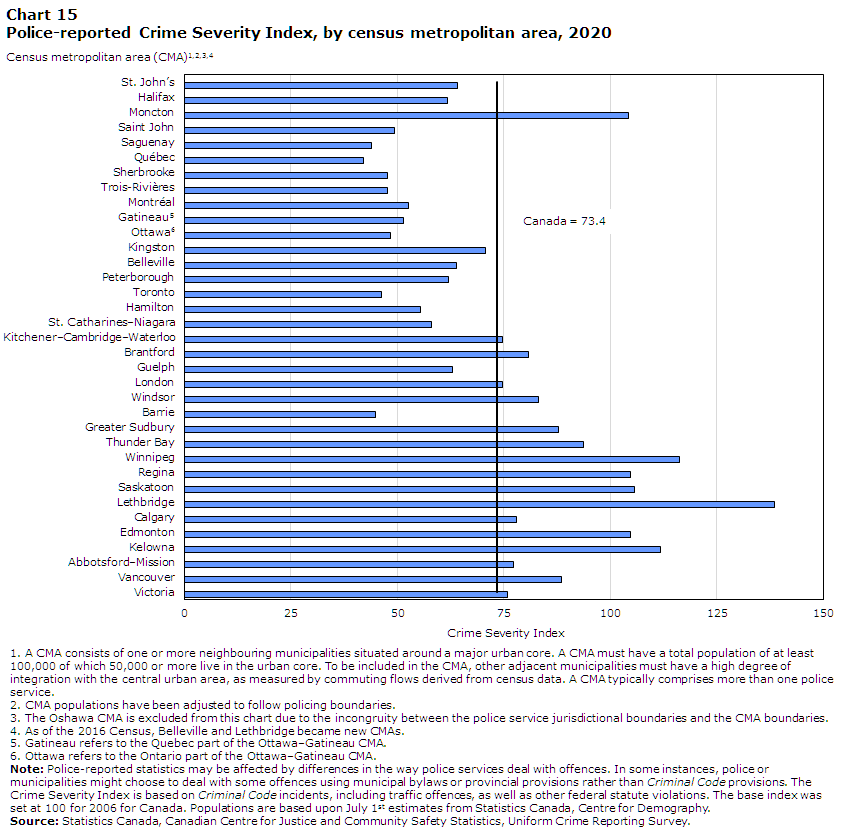
Between 2019 and 2020, 27 of 35 census metropolitan areas (CMA) reported decreases in their CSI (Table 11; Chart 15). Note The largest decreases in CSI were recorded in the CMA s of Regina (-20%), Calgary (-17%), Ottawa (-16%) and Barrie (-16%). The offences contributing to the decreases in these CMA s were somewhat varied, though generally breaking and entering, shoplifting of $5,000 or under, robbery and fraud drove the decreases to varying degrees (Table 12).
Data table for Chart 15
A CMA consists of one or more neighbouring municipalities situated around a major urban core. A CMA must have a total population of at least 100,000 of which 50,000 or more live in the urban core. To be included in the CMA , other adjacent municipalities must have a high degree of integration with the central urban area, as measured by commuting flows derived from census data. A CMA typically comprises more than one police service.
CMA populations have been adjusted to follow policing boundaries.
The Oshawa CMA is excluded from this chart due to the incongruity between the police service jurisdictional boundaries and the CMA boundaries.
As of the 2016 Census, Belleville and Lethbridge became new CMA s.
Gatineau refers to the Quebec part of the Ottawa–Gatineau CMA .
Ottawa refers to the Ontario part of the Ottawa–Gatineau CMA .
The largest increases in CSI between 2019 and 2020 were reported in Peterborough (+14%), Greater Sudbury (+7%), Kingston (+4%) and Victoria (+3%) (Table 12). Similar to the CMA s with large year-over-year decreases, those showing increases were driven by a variety of offences, including, in part, increases in the rate of breaking and entering and identity theft or fraud.
Similar to the provincial trend, the highest CSI s are typically recorded in CMA s located in British Columbia and the Prairie provinces, whereas the lowest CSI s are most often recorded in Quebec, Ontario and the Atlantic provinces. Lethbridge (138.7), Winnipeg (116.3), and Kelowna (111.9) were the CMA s with the highest CSI s in 2020, though all reported decreases from the previous year. The CMA s with the lowest CSI s were Québec (42.1), Saguenay (43.9) and Barrie (44.9), followed by Toronto (46.2), Trois-Rivières (47.7), Sherbrooke (47.8) and Ottawa (48.3).
In 2020, police-reported violent crime accounted for about one-quarter (24%) of all police-reported Criminal Code offences (excluding traffic). This is a higher proportion than in 2019 (22%), though this is due to the large decrease in non-violent crime, rather than a notable change in violent crime. There were over 476,600 police-reported violent incidents in 2020, marking a 2% drop in the rate of police-reported violent offences (1,254 per 100,000 population versus 1,279 in 2019). This decrease follows five years of increases, including an 11% increase in 2019. The rate was also 3% lower than a decade earlier (Table 8). Violent crime refers to those violations in the Criminal Code identified as crimes against the person, as opposed to property crimes and other Criminal Code violations such as offences against the administration of justice. Note
Between 2019 and 2020, rate changes were varied across violation types; 14 out of the 24 violation groups typically reported experienced decreases, and 10 experienced increases, most notably: robbery (-18%), trafficking in persons (-13%), Note sexual assault (level 1) (-9%), extortion (+28%) and violent firearms offences (+15%).
In the context of the pandemic, where the rates of the majority of criminal offences were lower than the previous year, several violent offences remained at similar levels or increased. While violent offences are by definition committed against a person, many can be committed without physical contact, for example harassing or threatening behaviours, firearm offences or extortion, which may be a factor in why these offences were not as affected by the restrictions set forth to contain the pandemic.
In 2020, the overall volume and severity of violent crime—as measured by the Violent Crime Severity Index (VCSI)—was 87.0, a 4% decrease from 2019 and 2% lower than in 2010 (Table 7; Chart 9). Prior to 2020, the VCSI fell every year between 2007 and 2014, before increasing for five consecutive years.
The largest contributor to the decrease in the VCSI in 2020 was an 18% decrease in the rate of robbery, and to a lesser extent, a 9% decrease in the rate of sexual assault (level 1) (see Text box 8). Overall, the rate decreased for 14 of the 24 violent offences or offence groupings typically reported by the UCR (Table 1).
Most provinces recorded decreases in their VCSI in 2020, though the national decrease was primarily driven by declines in Ontario and Manitoba (Table 9). Nova Scotia reported the largest increase in the VCSI , increasing 18%. The majority (72%) of the increase was due to an increase in homicide violations. In April 2020, 22 people were killed and 3 others were injured in a mass shooting in Nova Scotia, marking the deadliest mass shooting in Canadian history.
Decreases in VCSI s were reported in 17 out of 35 CMA s, while another 2 remained stable. The largest decreases were reported in Moncton (-25%), Belleville (-23%), Barrie (-20%) and Ottawa (-20%) (Table 11). Most of the decreases were driven by declines in robbery, sexual assault (level 1) or homicide.
Similarly, the largest increases in VCSI among the CMA s were typically the result of increases in homicide, sexual assault (level 1) and assault (level 2). The largest increases were reported in Guelph (+26%), Peterborough (+23%) and Sherbrooke (+22%).
In 2020, the CMA s with the highest VCSI s were Winnipeg (154.8), Thunder Bay (152.5), Regina (127.0) and Saskatoon (119.9). From 2005 to 2020, Thunder Bay, Winnipeg and Regina consistently reported among the highest VCSI values of all CMA s, with Thunder Bay and Winnipeg reporting among the three highest values every year for the past ten years. Thunder Bay also reported the fourth highest violent crime rate (1,659 violent incidents per 100,000 population) in 2020, behind Lethbridge (1,890), Moncton (1,780) and Kelowna (1,721) (Table 13; Chart 16). The lowest VCSI s were reported in Barrie (50.0), Ottawa (55.7), St. Catharines-Niagara (56.6) and Québec (56.8).

Data table for Chart 16
A CMA consists of one or more neighbouring municipalities situated around a major urban core. A CMA must have a total population of at least 100,000 of which 50,000 or more live in the urban core. To be included in the CMA , other adjacent municipalities must have a high degree of integration with the central urban area, as measured by commuting flows derived from census data. A CMA typically comprises more than one police service.
CMA populations have been adjusted to follow policing boundaries.
The Oshawa CMA is excluded from this chart due to the incongruity between the police service jurisdictional boundaries and the CMA boundaries.
As of the 2016 Census, Belleville and Lethbridge became new CMA s.
Gatineau refers to the Quebec part of the Ottawa–Gatineau CMA .
Ottawa refers to the Ontario part of the Ottawa–Gatineau CMA .
Start of text box 8
In April 2020, 22 people were killed and 3 others were injured in a mass shooting in Nova Scotia, marking the deadliest mass shooting in Canadian history. This event has impacted the crime severity index at the provincial and national level.
End of text box 8
In 2020, police reported 743 homicides, 56 more than the previous year. The national homicide rate increased 7% from 1.83 homicides per 100,000 population in 2019, to 1.95 homicides per 100,000 population in 2020. Homicides represented 0.2% of all violent crimes, a similar proportion to previous years (Table 1; Chart 17; data table 35-10-0068-01).
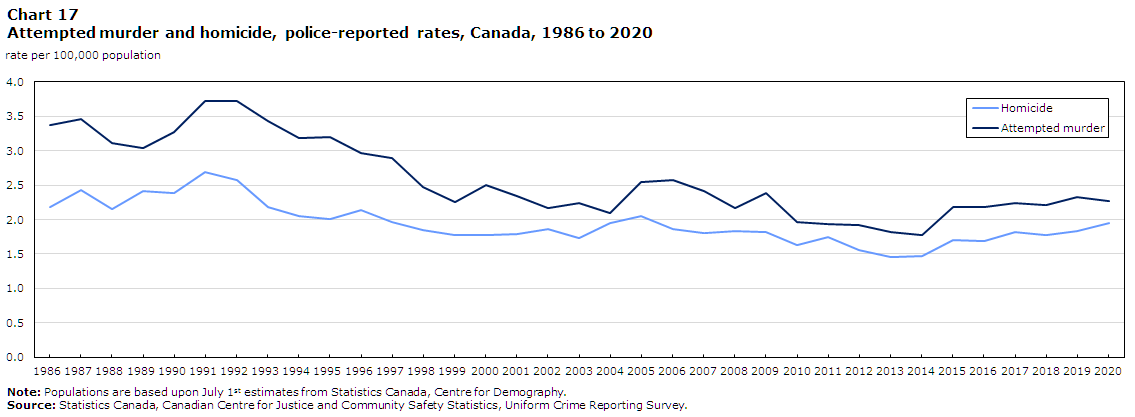
Data table for Chart 17
| Year | Homicide | Attempted murder |
|---|---|---|
| rate per 100,000 population | ||
| 1986 | 2.18 | 3.37 |
| 1987 | 2.43 | 3.46 |
| 1988 | 2.15 | 3.12 |
| 1989 | 2.41 | 3.04 |
| 1990 | 2.38 | 3.27 |
| 1991 | 2.69 | 3.72 |
| 1992 | 2.58 | 3.72 |
| 1993 | 2.19 | 3.43 |
| 1994 | 2.06 | 3.18 |
| 1995 | 2.01 | 3.20 |
| 1996 | 2.14 | 2.97 |
| 1997 | 1.96 | 2.89 |
| 1998 | 1.85 | 2.47 |
| 1999 | 1.77 | 2.26 |
| 2000 | 1.78 | 2.50 |
| 2001 | 1.78 | 2.34 |
| 2002 | 1.86 | 2.16 |
| 2003 | 1.74 | 2.23 |
| 2004 | 1.95 | 2.10 |
| 2005 | 2.06 | 2.55 |
| 2006 | 1.86 | 2.57 |
| 2007 | 1.81 | 2.41 |
| 2008 | 1.84 | 2.17 |
| 2009 | 1.81 | 2.38 |
| 2010 | 1.63 | 1.96 |
| 2011 | 1.74 | 1.94 |
| 2012 | 1.56 | 1.92 |
| 2013 | 1.46 | 1.81 |
| 2014 | 1.47 | 1.78 |
| 2015 | 1.71 | 2.18 |
| 2016 | 1.69 | 2.18 |
| 2017 | 1.82 | 2.25 |
| 2018 | 1.78 | 2.22 |
| 2019 | 1.83 | 2.33 |
| 2020 | 1.95 | 2.27 |
| Note: Populations are based upon July 1 st estimates from Statistics Canada, Centre for Demography. Source: Statistics Canada, Canadian Centre for Justice and Community Safety Statistics, Uniform Crime Reporting Survey. | ||
The number of homicides in Nova Scotia in 2020 was far higher than in previous years; in April 2020, 22 people were killed and 3 others were injured in a mass shooting in Nova Scotia, marking the deadliest mass shooting in Canadian history (CBC News 2020).
Overall, the increase in the national number of homicides was the result of more homicides in Alberta (+39, the second relatively large increase in a row), Nova Scotia (+29) and Quebec (+10). In contrast, with 19 fewer homicides in 2020, Ontario recorded the second relatively large decrease in a row. As has been the case with provincial comparisons historically, rates were highest in Saskatchewan (5.09 homicides per 100,000 population) and Manitoba (4.50), while the rate in Nova Scotia increased to 3.57 (+478%) due to the unprecedented tragedy in 2020. A high rate was also observed in the Northwest Territories (13.29 homicides per 100,000 population) and Nunavut (7.62), while there were no homicides reported in Yukon in 2020. The relatively small population counts in the Territories typically translate to higher and more unstable rates, making year-over-year comparisons less meaningful (Table 2; data table 35-10-0068-01).
For the fifth consecutive year, Thunder Bay, with 8 homicides, recorded the highest homicide rate among CMA s (6.35 homicides per 100,000 population) (Table 3). Barrie and Saguenay were the only CMA s with no homicides in 2020.
With 105 homicides, Toronto, Canada’s most populous CMA , had the most homicides in 2020, but the 16 th highest rate. Toronto’s rate declined 20% as a result of 25 fewer homicides. Among the CMA s, Edmonton and Calgary reported the largest increases in the number of homicides from 2019 to 2020 (+15 in both).
In 2020, there were 201 Indigenous victims of homicide, Note an increase from 179 in 2019. This represents a rate increase of 10% for Indigenous peoples in 2020 (10.05 per 100,000 Indigenous peoples in 2020 compared to 9.17 in 2019). This rate was approximately seven times higher than the rate for non-Indigenous people in 2020 (1.42 per 100,000 non-Indigenous people). Note Of the 201 Indigenous victims of homicide, 62% were identified by police as First Nations peoples, 4% as Métis and 9% as Inuk (Inuit). For an additional 24% of Indigenous victims of homicide, the Indigenous group to which they belonged was not identified. For more information on Indigenous victims of homicide, see data table 35-10-0156-01.
The number of female Indigenous victims decreased from 47 to 38, while the number of male victims rose by 32 (from 131 to 163). Note The highest rate of homicide was among Indigenous males (16.50 homicides per 100,000 population), followed by Indigenous females (3.76 per 100,000 population) and non-Indigenous males (2.14 per 100,000 population). Homicide rates were lowest among non-Indigenous females (0.69 per 100,000 population).
A history of colonization, including residential schools (the last of which closed in 1996), work camps and forced relocation is identified as having profoundly impacted Indigenous communities and families (Bombay et al. 2014; Bombay et al. 2011; Bombay et al. 2009; MMIWG 2019; The Truth and Reconciliation Commission of Canada 2015). Indigenous peoples often experience social and institutional marginalization, discrimination, and various forms of trauma and violence—including intergenerational trauma and gender-based violence. As a result, many Indigenous peoples experience challenging social and economic circumstances (Arriagada et al. 2020; MMIWG 2019; Statistics Canada 2020e; The Truth and Reconciliation Commission of Canada 2015). These factors play a significant role in the overrepresentation of Indigenous people in the criminal justice system and as victims of crime (Ontario Human Rights Commission 2003; House of Commons 2018).
For more information on homicide victims by age group, gender and Indigenous identity, see data tables 35-10-0156-01 and 35-10-0060-01.
Start of text box 9
Self-reported surveys provide an important complement to official police-reported data on crime. In Canada, two main national surveys collect crime-related data: the Uniform Crime Reporting (UCR) Survey and the General Social Survey (GSS) on Canadians’ Safety (Victimization). The UCR collects police-reported data, while the GSS on Victimization collects information from a sample of Canadians aged 15 and older on their experiences with crime. The GSS on Victimization is conducted every five years, with the most recent cycle having been conducted in 2019. Note Unlike the UCR , the GSS on Victimization captures information both on crimes that have been reported to police and those that have not. The GSS on Victimization, however, collects information for a subset of offences—sexual assault, robbery, physical assault, breaking and entering, theft of motor vehicles or their parts, theft of personal property, theft of household property and vandalism—and does not include crimes committed against businesses or institutions.
While both surveys are used to measure crime, significant methodological and conceptual differences exist between them and affect direct comparisons of data findings (for further information, see Wallace et al. 2009). It is possible, however, to compare the distribution of offences to better understand changes in the pattern of crimes reported to police. For instance, both surveys show that physical assault is the most common type of violent crime, and that sexual assault is more common than robbery.
In contrast, the GSS shows that women are at a greater risk of being a victim of a violent crime, which is considerably different from what is seen in police-reported data, where the overall rate of violent crime is only slightly higher among women than men. This difference can be attributed to several factors. Police-reported data includes a broader range of types of violent crime than does the GSS , which asks only about sexual assault, robbery, and physical assault. In addition, sexual assault is vastly underreported to police, meaning that a large part of violent crime that disproportionately affects women is the least likely to be reflected in official data. (Cotter forthcoming 2021).
According to the GSS on Victimization, 29% of the eight crime types measured in the 2019 cycle were reported to the police. Reporting rates ranged from 6% of sexual assault to 52% of motor vehicle or motor vehicle parts thefts. Moreover, retrospective questions on child abuse also show that, for the vast majority (93%) of those who were victimized by an adult before age 15, the abuse was never reported to the police or child protective services (Cotter forthcoming 2021).
To further complement police-reported data and to advance knowledge of gender-based violence in Canada, Statistics Canada conducted the first cycle of the Survey of Safety in Public and Private Spaces (SSPPS) in 2018, with a new collection cycle planned every five years. The SSPPS collects self-reported information on experiences and characteristics of violent victimization as well as the continuum of other unwanted experiences while in public, online, or at work. According to SSPPS , the vast majority of incidents of violent crime occurring in the 12 months preceding the survey did not come to the attention of police: 5% of women stated that police found out about the most serious incident of sexual assault they experienced, while 26% of women and 33% of men who were physically assaulted said likewise (Cotter and Savage 2019).
End of text box 9
Police-reported trafficking in persons, or human trafficking, involves recruiting, transporting, transferring, receiving, holding, concealing or harbouring a person, or exercising control, direction or influence over the movements of a person, for the purpose of exploiting them or facilitating their exploitation by someone else (Public Safety Canada 2019b; UNODC 2018). Victims disproportionately tend to come from vulnerable or marginalized populations, mostly young women or children, and due to the nature of the offence, the true scope of human trafficking in Canada is underestimated (Public Safety Canada 2019b; Department of Justice Canada 2015). The United Nations Office on Drugs and Crime and the International Criminal Police Organization (INTERPOL) have indicated that COVID-19-induced economic recessions and job loss across the globe may be exposing more people to the risks associated with human trafficking ( INTERPOL 2020; UNODC 2021).
In 2020, there was a combined total of 515 incidents of human trafficking offences reported under the Criminal Code (342 incidents) and the Immigration and Refugee Protection Act (IRPA) (173 incidents). This was down slightly from 2019, the year with highest number of incidents ever reported (546 incidents) (Table 1). Overall, the combined number of incidents of human trafficking has been on an upward trend since 2011. Note
From 2010 to 2020, there has been a total of 2,977 incidents of human trafficking, with the majority (70%) being Criminal Code human trafficking offences. While Criminal Code incidents may or may not involve the crossing of international borders, the IRPA specifically refers to incidents of cross-border human trafficking, suggesting at least 30% of human trafficking incidents involved the crossing of the Canadian border. The majority of human trafficking incidents were reported in Ontario (1,938 incidents, or 65%), and in general, human trafficking incidents tended to occur in urban centres, notably Toronto, Ottawa, Montréal and Halifax.
For more detailed information on human trafficking in Canada, refer to Ibrahim 2021. Note
In 2020, most crime reported by police continued to be non-violent, with property offences and other Criminal Code offences accounting for over three quarters (76%) of police-reported Criminal Code incidents (excluding traffic). In total, there were over 1.5 million police-reported non-violent incidents in 2020 (excluding traffic), of which nearly 1.2 million were property crimes (Table 8). The rate of property crime dropped for the first time following three years of increases, decreasing 13% from 2019 to 2020. The property crime rate fell from 3,512 to 3,071 incidents per 100,000 population between 2019 and 2020. Based on historical UCR data (which is not directly comparable to data released in the new UCR 2 format), the 2020 property crime rate was the lowest since 1966 (Chart 10).
Between 2019 and 2020, Canada’s Non-violent Crime Severity Index (NVCSI), which includes property and other non-violent Criminal Code offences, drug crime, other federal statutes and Criminal Code traffic offences, decreased 10% (Table 7). The primary offences contributing to the decrease were breaking and entering, theft of $5,000 or under and shoplifting of $5,000 or under. These were partially offset by an increase in child pornography (see Text box 10).
Between 2019 and 2020, 10 of the 13 provinces and territories reported decreases in their NVCSI (Table 9). Among the provinces, the largest decreases were reported in Alberta (-14%), Quebec (-11%), Prince Edward Island (-10%), Manitoba (-10%), British Columbia (-10%), Ontario (-9%) and Saskatchewan (-9%). In the Territories, Yukon (-2%) and Nunavut (-1%) decreased, while the Northwest Territories increased (+6%).
The majority (29 of 35) of census metropolitan areas (CMAs) Note recorded decreases in the NVCSI in 2020 (Table 11). The largest decreases were recorded in Regina (-26%), Trois-Rivières (-19%), Calgary (-19%) and Abbotsford-Mission (-17%). Breaking and entering, theft of $5,000 or under, shoplifting of $5,000 or under, motor vehicle theft and fraud combined to be significant contributors to the decreased NVCSI s in most of these CMA s. Child pornography, identity theft and identity fraud were important contributors, either offsetting decreases or driving changes for CMA s with increased NVCSI s. Increases in the NVCSI were recorded in Peterborough (+9%), Kitchener-Cambridge-Waterloo (+4%), Halifax (+3%), Moncton (+2%), Greater Sudbury (+2%) and Kingston (+2%).
Start of text box 10
The Montréal CMA in Quebec accounted for the majority of the national decrease in importation or exportation offences reported under the Cannabis Act, decreasing 72% (4,180 fewer incidents) from 2019 to 2020. The large decrease in offences year-over-year was due in part to fewer postal seizures and seizures conducted by the Canada Border Services Agency in Montréal since the beginning of the COVID-19 pandemic. Additionally, the Vancouver CMA in British Columbia accounted for 56% of all importation or exportation offences reported under the Cannabis Act (4,194 of the 7,552 offences reported nationally). The high proportion of offences was due in part to seizure cases, conducted by the Canada Border Services Agency and the Canada Post Mail Centre in the Vancouver CMA , being forwarded for processing and investigation. As a result of this exchange, the year in which occurrences were reported by the Royal Canadian Mounted Police may not always correspond to the year in which they occurred.
End of text box 10
According to the Insurance Bureau of Canada (IBC), aspects of motor vehicle theft are related to organized crime, including money laundering and the resale of high-end cars. The most common motivations for motor vehicle theft, according to the IBC , are to sell the stolen vehicle overseas, to resell the vehicle to an unsuspecting buyer, to use the vehicle in “joyriding,” and to steal the vehicle in the commission of another crime and subsequently abandon it (Sommerfeld 2018). Recently, police and news media reports have indicated country-wide and international increases in thefts of catalytic converters (part of the exhaust system) from vehicles in order to salvage precious metals which have risen in value in recent years (Bueckert 2021). The Insurance Corporation of British Columbia, for example, reported that the number of these claims has increased 10-fold over 5 years, and there have been reports of several incidents or large seizures in short periods of time in Ontario and New Brunswick (CBC News 2021).
Despite this relatively recent issue of thefts of catalytic converters, there were 8,890 fewer incidents of motor vehicle theft (including parts) in 2020 compared to 2019, resulting in an 11% decrease in rate. The rate of motor vehicle theft in Canada was 24% lower in 2020 than a decade earlier (Chart 18). Almost all provinces and all three territories experienced decreases in the rate of motor vehicle theft, with the exceptions of Newfoundland and Labrador (+12%) and New Brunswick (+1%), while Ontario did not report a change year-over-year. Large decreases in British Columbia (-23%) and Alberta (-20%) were the primary contributors to the decrease (Table 2). As in the provinces and territories, the majority (27 of 35) of the CMA s recorded decreases (Table 3).

Data table for Chart 18
| Year | Motor vehicle theft |
|---|---|
| rate per 100,000 population | |
| 1986 | 328 |
| 1987 | 329 |
| 1988 | 334 |
| 1989 | 367 |
| 1990 | 412 |
| 1991 | 497 |
| 1992 | 518 |
| 1993 | 546 |
| 1994 | 550 |
| 1995 | 552 |
| 1996 | 608 |
| 1997 | 592 |
| 1998 | 550 |
| 1999 | 531 |
| 2000 | 522 |
| 2001 | 544 |
| 2002 | 516 |
| 2003 | 551 |
| 2004 | 532 |
| 2005 | 496 |
| 2006 | 487 |
| 2007 | 443 |
| 2008 | 378 |
| 2009 | 321 |
| 2010 | 272 |
| 2011 | 240 |
| 2012 | 225 |
| 2013 | 207 |
| 2014 | 209 |
| 2015 | 221 |
| 2016 | 219 |
| 2017 | 233 |
| 2018 | 233 |
| 2019 | 232 |
| 2020 | 206 |
| Note: Populations are based upon July 1 st estimates from Statistics Canada, Centre for Demography. Source: Statistics Canada, Canadian Centre for Justice and Community Safety Statistics, Uniform Crime Reporting Survey. | |
Police reported just over 77,600 impaired driving incidents in 2020, over 8,200 fewer incidents compared to the year before. The decrease in 2020 follows the largest increase dating back to 1987 (Chart 19).
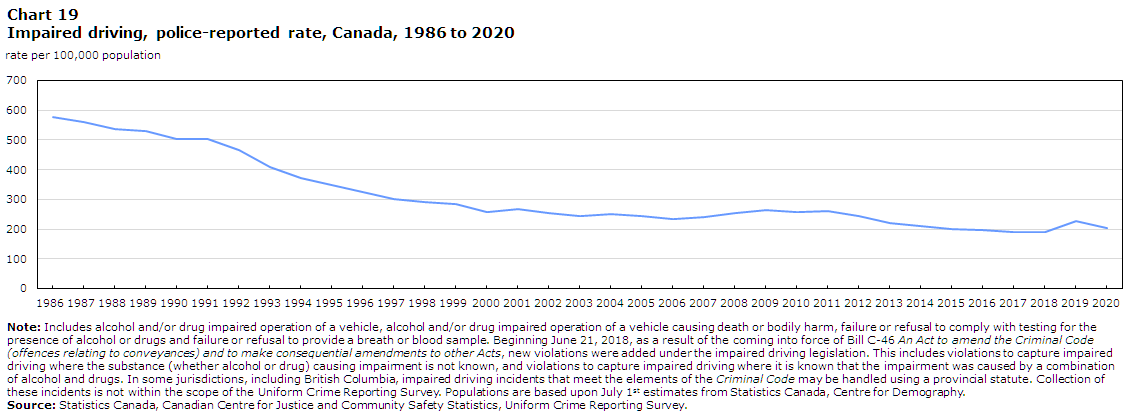
Data table for Chart 19
| Year | Impaired driving |
|---|---|
| rate per 100,000 population | |
| 1986 | 577 |
| 1987 | 561 |
| 1988 | 538 |
| 1989 | 529 |
| 1990 | 502 |
| 1991 | 502 |
| 1992 | 467 |
| 1993 | 410 |
| 1994 | 372 |
| 1995 | 349 |
| 1996 | 325 |
| 1997 | 301 |
| 1998 | 291 |
| 1999 | 283 |
| 2000 | 258 |
| 2001 | 267 |
| 2002 | 255 |
| 2003 | 245 |
| 2004 | 252 |
| 2005 | 243 |
| 2006 | 234 |
| 2007 | 241 |
| 2008 | 255 |
| 2009 | 263 |
| 2010 | 257 |
| 2011 | 261 |
| 2012 | 242 |
| 2013 | 221 |
| 2014 | 210 |
| 2015 | 201 |
| 2016 | 197 |
| 2017 | 189 |
| 2018 | 191 |
| 2019 | 228 |
| 2020 | 204 |
| Note: Includes alcohol and/or drug impaired operation of a vehicle, alcohol and/or drug impaired operation of a vehicle causing death or bodily harm, failure or refusal to comply with testing for the presence of alcohol or drugs and failure or refusal to provide a breath or blood sample. Beginning June 21, 2018, as a result of the coming into force of Bill C-46 An Act to amend the Criminal Code (offences relating to conveyances) and to make consequential amendments to other Acts, new violations were added under the impaired driving legislation. This includes violations to capture impaired driving where the substance (whether alcohol or drug) causing impairment is not known, and violations to capture impaired driving where it is known that the impairment was caused by a combination of alcohol and drugs. In some jurisdictions, including British Columbia, impaired driving incidents that meet the elements of the Criminal Code may be handled using a provincial statute. Collection of these incidents is not within the scope of the Uniform Crime Reporting Survey. Populations are based upon July 1 st estimates from Statistics Canada, Centre for Demography. Source: Statistics Canada, Canadian Centre for Justice and Community Safety Statistics, Uniform Crime Reporting Survey. | |
Conditions brought about by the COVID-19 pandemic may have impacted the incidence of impaired driving. Restrictions and economic impacts may make individuals more stressed or anxious, which could result in individuals consuming more or different substances that could cause impairment. Further, alternatives to driving, for example public transport or ride-share programs may have been reduced or altered, such that people may be more likely to drive while impaired. On the other hand, driving patterns may have changed as fewer people leave their homes, especially to go to restaurants or bars, and therefore are less likely to be driving on the roads while impaired.
Most provinces and two territories reported decreases from 2019. The largest rate decreases were seen in Quebec (-24%), Alberta (-20%) and Prince Edward Island (-17%), while increases were reported in Saskatchewan (+11%), Manitoba (+9%) and Nunavut (+3%) (Table 2).
The majority (79%) of police-reported impaired driving incidents continued to involve alcohol in 2020, however this proportion has been declining in recent years, as a growing proportion of incidents involved drugs (10%), or involved a combination of alcohol and drugs (9%).
Recently, rates of impaired driving have been impacted by legislation enacted under former Bill C-46, “An Act to amend the Criminal Code (offences relating to conveyances) and to make consequential amendments to other Acts,” which came into force in two parts – part one on June 21, 2018, and part two on December 18, 2018. This legislation introduced amendments to Criminal Code sections related to impaired driving, including giving police new powers to conduct alcohol and drug screening. New violations were included to capture impaired driving where the substance (whether alcohol or drugs) causing impairments was not known, and violations to capture impaired driving where it was known that impairment was caused by a combination of alcohol and drugs. For more detailed information on the new legislation and impaired driving in Canada in general, refer to Perreault 2021.
The rate for all drug-impaired driving violations increased 15% between 2019 and 2020 (Chart 20). In total, there were 7,510 drug-impaired driving violations in 2020, 1,037 more than the previous year (Table 1). Prior to the coming into force of the new impaired driving legislation, in incidents where the driver may have been impaired by both alcohol and drugs, it was generally easier for police to lay charges for alcohol-impaired driving and the majority of cases were reported as such (Owusu-Bempah 2014; Perreault 2016). Under the new legislation this may be changing, as there was also a significant increase in the number of incidents reported as impaired driving caused by a combination of alcohol and drugs, rising 59% from 4,479 incidents to 7,105.
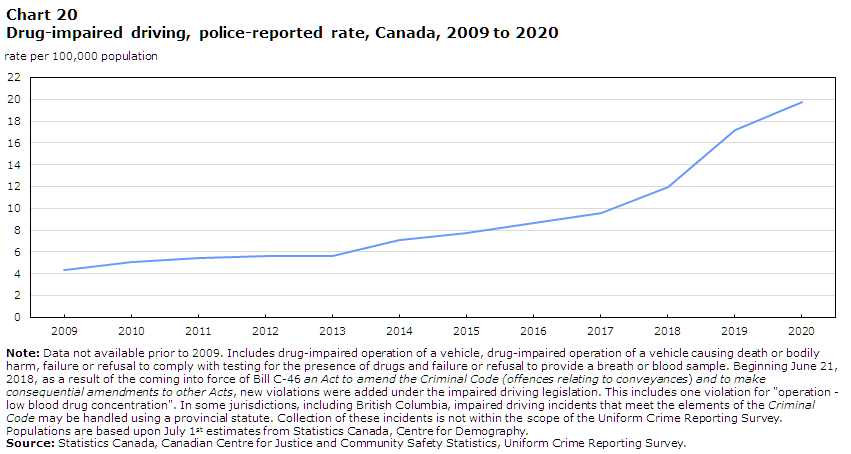
Data table for Chart 20
| Year | Drug-impaired driving |
|---|---|
| rate per 100,000 population | |
| 2009 | 4 |
| 2010 | 5 |
| 2011 | 5 |
| 2012 | 6 |
| 2013 | 6 |
| 2014 | 7 |
| 2015 | 8 |
| 2016 | 9 |
| 2017 | 10 |
| 2018 | 12 |
| 2019 | 17 |
| 2020 | 20 |
| Note: Data not available prior to 2009. Includes drug-impaired operation of a vehicle, drug-impaired operation of a vehicle causing death or bodily harm, failure or refusal to comply with testing for the presence of drugs and failure or refusal to provide a breath or blood sample. Beginning June 21, 2018, as a result of the coming into force of Bill C-46 an Act to amend the Criminal Code (offences relating to conveyances) and to make consequential amendments to other Acts, new violations were added under the impaired driving legislation. This includes one violation for "operation - low blood drug concentration". In some jurisdictions, including British Columbia, impaired driving incidents that meet the elements of the Criminal Code may be handled using a provincial statute. Collection of these incidents is not within the scope of the Uniform Crime Reporting Survey. Populations are based upon July 1 st estimates from Statistics Canada, Centre for Demography. Source: Statistics Canada, Canadian Centre for Justice and Community Safety Statistics, Uniform Crime Reporting Survey. | |
The increase in drug-impaired driving violations was almost entirely the result of more incidents in Ontario (+686 incidents), and Quebec (+336 incidents). On the other hand, Quebec and British Columbia were the only areas among provinces or territories to record decreases in incidents of impaired driving caused by a combination of alcohol and drugs.
The number of impaired driving offences reported by police can be influenced by a number of factors, including changes in legislation, varying law enforcement practices across jurisdictions (e.g., roadside check programs such as Ontario’s Reduce Impaired Driving Everywhere [RIDE] Program), as well as changing societal attitudes (Perreault 2016). In some jurisdictions, like British Columbia, impaired driving incidents that meet the elements of the Criminal Code may be handled using a provincial statute. Specifically, changes in impaired driving offences, and particularly drug-impaired driving offences, may be due in part to several contributing factors: greater legislative powers to conduct drug and alcohol screening tests, an increased number of police officers trained to detect impaired driving through standardized field sobriety tests, an increased number drug recognition experts leading to more confirmed instances of impairment, as well as increased use of oral fluid screening devices to detect drug impairment.
Given the new legislation and the additional means available to police to detect drug-impaired driving, it is possible that at least part of the observed increase was due to better detection rather than a true rise in drug-impaired driving. According to the Police Administration Survey, 604 Drug Recognition Experts (DREs) were trained in the 2018/2019 fiscal year. In total, there were just over 1,000 DRE certified officers. During this same period, more than 8,000 police officers completed training or an update on the standardized field sobriety test. Therefore, awareness and capacity to detect drug-impaired driving has evolved rapidly in recent years. For more detailed information on drug-impaired driving in Canada up to and including the year 2019, see Perreault 2021.
Police do not report the type of drug associated with a drug-impaired driving incidents for the purposes of the UCR . As such, it is difficult to determine the impact of the new cannabis legalization on drug-impaired driving. According to Statistics Canada’s National Cannabis Survey, among cannabis users with a valid driver’s license, 13.2% reported driving within two hours of using, which was similar to prior to legalization (14.2%) (Rotermann 2020).
While overall crime statistics are based on the number of criminal incidents reported by police (regardless of whether or not an accused was identified), measures of police-reported youth crime are based on the number of youth, aged 12 to 17, accused in a criminal incident by police. Note The number of youth accused includes youth who were either charged, or recommended for charge, as well as those who were cleared by other means, including those diverted from the formal criminal justice system through the use of warnings, cautions, referrals to community programs and other diversion programs.
In 2020, there were about 54,300 youth accused of a criminal offence, nearly 23,200 fewer than in the previous year. The youth crime rate dropped 31% and has been on a long downward trend, declining for over two decades after peaking in 1991 (Table 14; Table 15). Given the focus of the Youth Criminal Justice Act is to divert youth away from the criminal justice system where possible, this may have exacerbated the impacts of the pandemic, both in terms of changes to the administration of justice and in terms of opportunities for youth to commit crimes. Between 2010 and 2020, the rate of youth accused of crime fell 63% and the Youth CSI (YCSI) – which measures both the volume and severity of crime involving youth accused (charged and not charged) – fell 53% (Table 16; Chart 21).
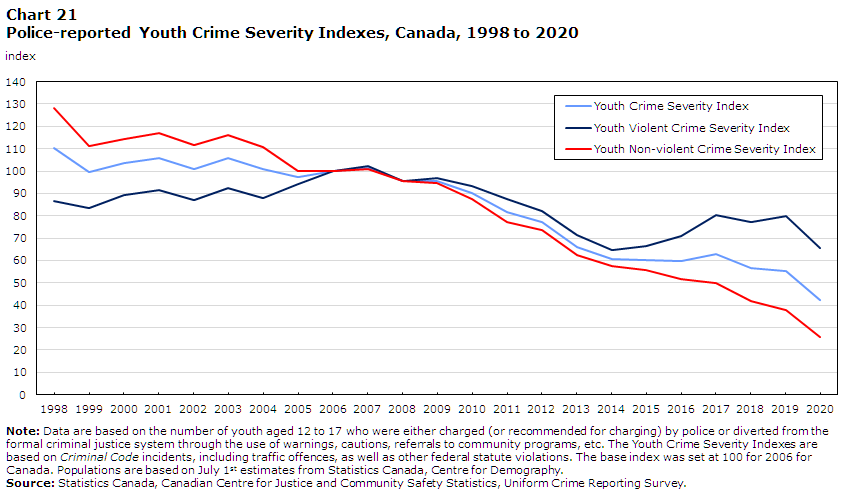
Data table for Chart 21
| Year | Youth Crime Severity Index | Youth Violent Crime Severity Index | Youth Non-violent Crime Severity Index |
|---|---|---|---|
| index | |||
| 1998 | 110.2 | 86.6 | 128.3 |
| 1999 | 99.3 | 83.5 | 111.4 |
| 2000 | 103.5 | 89.3 | 114.4 |
| 2001 | 106.0 | 91.4 | 117.1 |
| 2002 | 101.1 | 87.3 | 111.7 |
| 2003 | 106.0 | 92.6 | 116.2 |
| 2004 | 100.9 | 87.9 | 110.8 |
| 2005 | 97.4 | 94.2 | 99.8 |
| 2006 | 100.0 | 100.0 | 100.0 |
| 2007 | 101.5 | 102.1 | 101.0 |
| 2008 | 95.7 | 95.7 | 95.6 |
| 2009 | 95.6 | 96.7 | 94.7 |
| 2010 | 90.0 | 93.2 | 87.6 |
| 2011 | 81.7 | 87.5 | 77.3 |
| 2012 | 77.4 | 82.3 | 73.6 |
| 2013 | 66.2 | 71.2 | 62.3 |
| 2014 | 60.6 | 64.8 | 57.4 |
| 2015 | 60.4 | 66.4 | 55.9 |
| 2016 | 59.9 | 70.9 | 51.8 |
| 2017 | 62.7 | 80.5 | 49.9 |
| 2018 | 56.6 | 77.0 | 42.1 |
| 2019 | 55.1 | 79.8 | 37.7 |
| 2020 | 42.3 | 65.7 | 26.0 |
| Note: Data are based on the number of youth aged 12 to 17 who were either charged (or recommended for charging) by police or diverted from the formal criminal justice system through the use of warnings, cautions, referrals to community programs, etc. The Youth Crime Severity Indexes are based on Criminal Code incidents, including traffic offences, as well as other federal statute violations. The base index was set at 100 for 2006 for Canada. Populations are based on July 1 st estimates from Statistics Canada, Centre for Demography. Source: Statistics Canada, Canadian Centre for Justice and Community Safety Statistics, Uniform Crime Reporting Survey. | |||
The decline in the YCSI in 2020 was the result of widespread decreases in the rates of nearly all violations or violation groupings typically reported (Table 14). All provinces and territories experienced decreases in the YCSI , Violent YCSI and Non-violent YCSI , with the exception of Yukon, where the Violent YCSI increased and resulted in an increase in the overall YCSI (Table 17). Due to their small populations and comparatively fewer incident counts, the Territories are more susceptible to considerable year-over-year fluctuations in both their Crime Severity Index and crime rates.
Similar to previous years, the most common criminal offences committed by youth in 2020 were level 1 assault (374 accused per 100,000 youth), mischief (281) and administration of justice violations (256), such as breach of probation and failure to appear (Table 14). Rates of shoplifting of $5,000 or under and uttering threats were also relatively high.
The first year of the COVID-19 pandemic had an unprecedented impact on the economic and social lives of Canadians. As a result of efforts to contain the spread of the virus, the way people lived, worked and socialized changed drastically, with many people staying at home for long periods of times and avoiding public gatherings and businesses adjusting their operations to serve Canadians in new or different ways. At least partially as a result of these changes, police-reported crime in Canada dropped throughout the pandemic period in general, yet there were important differences for some types of crime.
In 2020, all measures of the police-reported Crime Severity Index (CSI) – the overall CSI , the Violent CSI and the Non-violent CSI – decreased, following five consecutive annual increases. The decline in the overall CSI in 2020 was the result of decreases in police-reported rates of numerous offences. Notably, there were decreases in the rates of police-reported breaking and entering (-16%), theft of $5,000 or under (-20%), robbery (-18%), shoplifting of $5,000 or under (-36%), administration of justice violations (-17%) and sexual assault (level 1) (-9%). In contrast, rates of some offences increased in 2020, including child pornography (+23%), offences related to opioids (+34%), identity theft (+52%) and identity fraud (+12%), and harassing and threatening behaviours.
In April 2020, 22 people were killed and 3 others were injured in a mass shooting in Nova Scotia, marking the deadliest mass shooting in Canadian history. Nationally, there were 743 homicides, 56 more than the previous year. The national homicide rate increased 7% from 1.83 homicides per 100,000 population in 2019, to 1.95 homicides per 100,000 population in 2020.
To publish police-reported crime statistics in a timely manner, this article relies mostly on aggregate data (totals), which are the first crime data available each calendar year. There will continue to be more detailed analyses of these data and microdata forthcoming to help inform the pandemic situation and Canadian’s safety and wellbeing.
Incident (or Offence): A criminal incident involves one or more related offences that are committed during a single criminal event and have been reported to police. Where there are multiple victims within a single criminal event, a separate aggregate incident is counted for each victim. For example, a single incident involving an assault on three victims at the same time and location is counted in the aggregate statistics as three incidents of assault. For an incident to be counted in the crime statistics it must be recorded as “founded” as opposed to “unfounded.” Police services can report up to four violations for each incident, however, for both the traditional crime rate and the CSI are based on the most serious violation in the criminal incident. For the purposes of this article, offence and incident are used interchangeably.
Most serious violation: Individuals accused of crime are categorized by the most serious violation occurring in the police-reported incident in which they are accused. In incidents with multiple accused involving multiple violations, each individual in the incident will be coded with the most serious violation even if this was not the violation(s) that the person was accused of committing. It is therefore possible that the most serious violation is not the offence for which an individual was accused, but one committed by another accused in the incident. Moreover, in this type of incident, any charges against the accused may be for less serious offences in the incident.
Founded: An incident is “founded” if, after police investigation it has been determined that the reported offence did occur or was attempted (even if the charged/suspect chargeable (CSC) [i.e., the accused] is unknown) or there is no credible evidence to confirm that the reported incident did not take place. This includes third-party reports that fit these criteria. For the Uniform Crime Reporting Survey, the concept of a CSC refers to a person against whom there is enough evidence for police to either lay a charge or recommend to the Crown that a charge be laid. Effective January 1, 2018.
Unfounded: An incident is “unfounded” if it has been determined through police investigation that the offence reported did not occur, nor was it attempted. Effective January 1, 2018.
Gang-related homicide: A homicide is classified as gang-related when police confirm or suspect that the accused person and/or victim involved in the homicide was either a member, or a prospective member, of an organized crime group or street gang or was somehow associated with an organized crime group or street gang, and the homicide was carried out as a result of this association. Prior to 2005, police were asked if the homicide was "gang-related". Beginning in 2005, the question was amended to give police the option of specifying whether the homicide was: (a) confirmed as gang-related or (b) suspected as being gang-related.
Firearm-related violent crime: Firearm-related violent crime shows the number of victims of violent Criminal Code offences where a firearm was fired or used as a threat, and/or where a firearm was present and not used but the presence of the firearm was relevant to the incident, according to the police.
Firearm-related homicide: A homicide is classified as firearm-related when the weapon used to cause death is a firearm. Firearms include handguns, rifles or shotguns, fully automatic firearms, firearm-like weapons (e.g. nail guns or pellet guns) and firearms - type unknown.
Violent offences: Involve the use or threat of violence against a person, including homicide, attempted murder, assault, sexual assault and robbery. Robbery is considered a violent offence because, unlike other theft offences, it involves the use or threat of violence. See Table 1 for a list of selected offences in this category.
Homicide: Includes first and second degree murder, manslaughter and infanticide. Deaths caused by criminal negligence, suicide and accidental or justifiable homicide are not included in this classification.
Assault (physical): Refers to the Criminal Code categories of physical assault.
Sexual assault: Is classified by level in the Criminal Code into three separate categories—depending on the nature and severity of the incident—including level 1, assault of a sexual nature that violates the sexual integrity of the victim; level 2, sexual assault with a weapon or causing bodily harm involves sexual assault with a weapon, threats to use a weapon or causing bodily harm; and level 3, aggravated sexual assault involves sexual assault that wounds, maims, disfigures or endangers the life of the victim.
Sexual violations against children: Include Criminal Code violations that specifically concern offences involving child and youth victims. These include sexual interference, invitation to sexual touching, sexual exploitation, making sexually explicit material available to children for the purpose of facilitating sexual offences against children/youth, luring a child via telecommunications or the agreement/arrangement by means of telecommunication to commit a sexual offence against a child. As of December 2014, also includes the offences of parent or guardian procuring sexual activity (Criminal Code, s. 170) and householder permitting prohibited sexual activity (Criminal Code, s. 171). A “householder” is any “owner, occupier or manager of premises, or any other person who has control of premises or assists in the management or control of premises” (Criminal Code, s. 171). Incidents of child pornography are not included in the category of sexual violations against children. Excludes incidents of sexual assault level 1, 2 and 3 against children and youth which are counted within those three violation categories.
Other sexual offences: not involving sexual assault or sexual violations against children are included with “other violent offences.”
Non-violent offences: Include property offences and other Criminal Code offences, as well as Criminal Code traffic offences, drug-related offences and violations of other federal statutes.
Property offences: Involve unlawful acts to gain property, but do not involve the use or threat of violence against the person. They include offences such as break and enter, theft and mischief. See Table 1 for a list of selected offences in this category.
“Other” Criminal Code offences: Include crimes such as disturbing the peace and offences against the administration of justice (e.g., failure to comply with an order, failure to appear and breach of probation).
Drug-related offences: Include offences under the Controlled Drugs and Substances Act such as possession, trafficking, production, importation and exportation of drugs or narcotics. Examples include cannabis (prior to the enactment of the Cannabis Act on October 17, 2018), cocaine, heroin and other drugs such as methamphetamine (crystal meth), PCP, LSD and ecstasy. Also includes cannabis-related offences under the Cannabis Act, and beginning in November 2017, violations specific to opioids (excluding heroin but including fentanyl).
Other federal statute violations: Include violations of federal statutes other than the Criminal Code and the Controlled Drugs and Substances Act. These include violations of the Youth Criminal Justice Act.